ACM conditioning changes Daoy MB cell morphology in vivo.
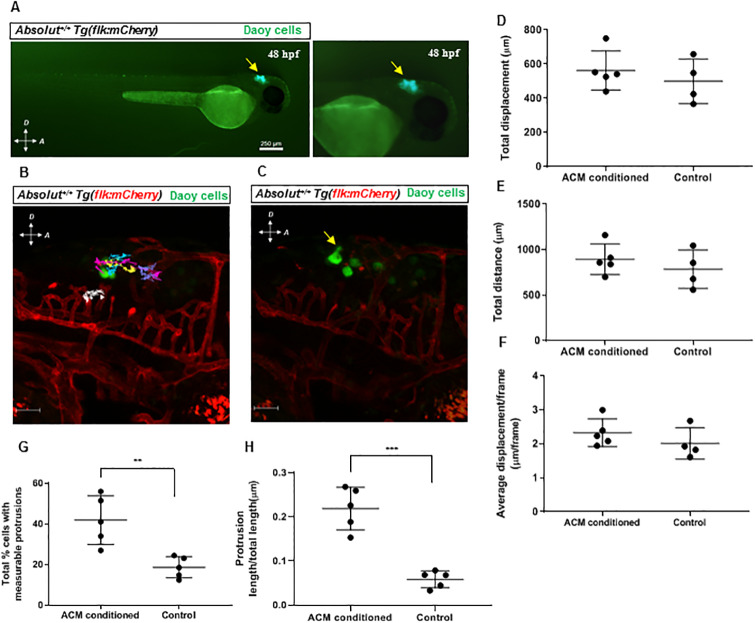
(A) Representative images of cells (yellow arrow) after injection into the hindbrains of 48 hpf Absolut+/+Tg(flk:mCherry) zebrafish embryos. Right panel is higher magnification. Scale bar is 250 μm. (B) Representative image of injected cells at the beginning of the time-lapse imaging. Colored lines show the tracked movement of individual cells during the time-lapse imaging, and the white line shows the tracked reference point movement. Scale bar is 50 μm. (C) Representative image of injected cell protrusion (yellow arrow). Scale bar is 50 μm. (D-F) Quantification of injected cell migration, represented by total cell displacement (D) and total distance (E) moved by all cells in first 12.5 hours (h) of imaging, and average displacement/frame (F) of cells through entire 24 h time lapse. (G-H) Quantification of injected Daoy cell protrusion formation, measured by average percent of visible cells with protrusions (G) and protrusion length to cell body size ratio (H). Quantified values expressed as mean +/- SD. **p<0.01, ***p<0.001.
This image is the copyrighted work of the attributed author or publisher, and
ZFIN has permission only to display this image to its users.
Additional permissions should be obtained from the applicable author or publisher of the image.
Full text @ PLoS One
Your Input Welcome
Thank you for submitting comments. Your input has been emailed to ZFIN curators who may contact you if
additional information is required.
Oops. Something went wrong. Please try again later.