
|
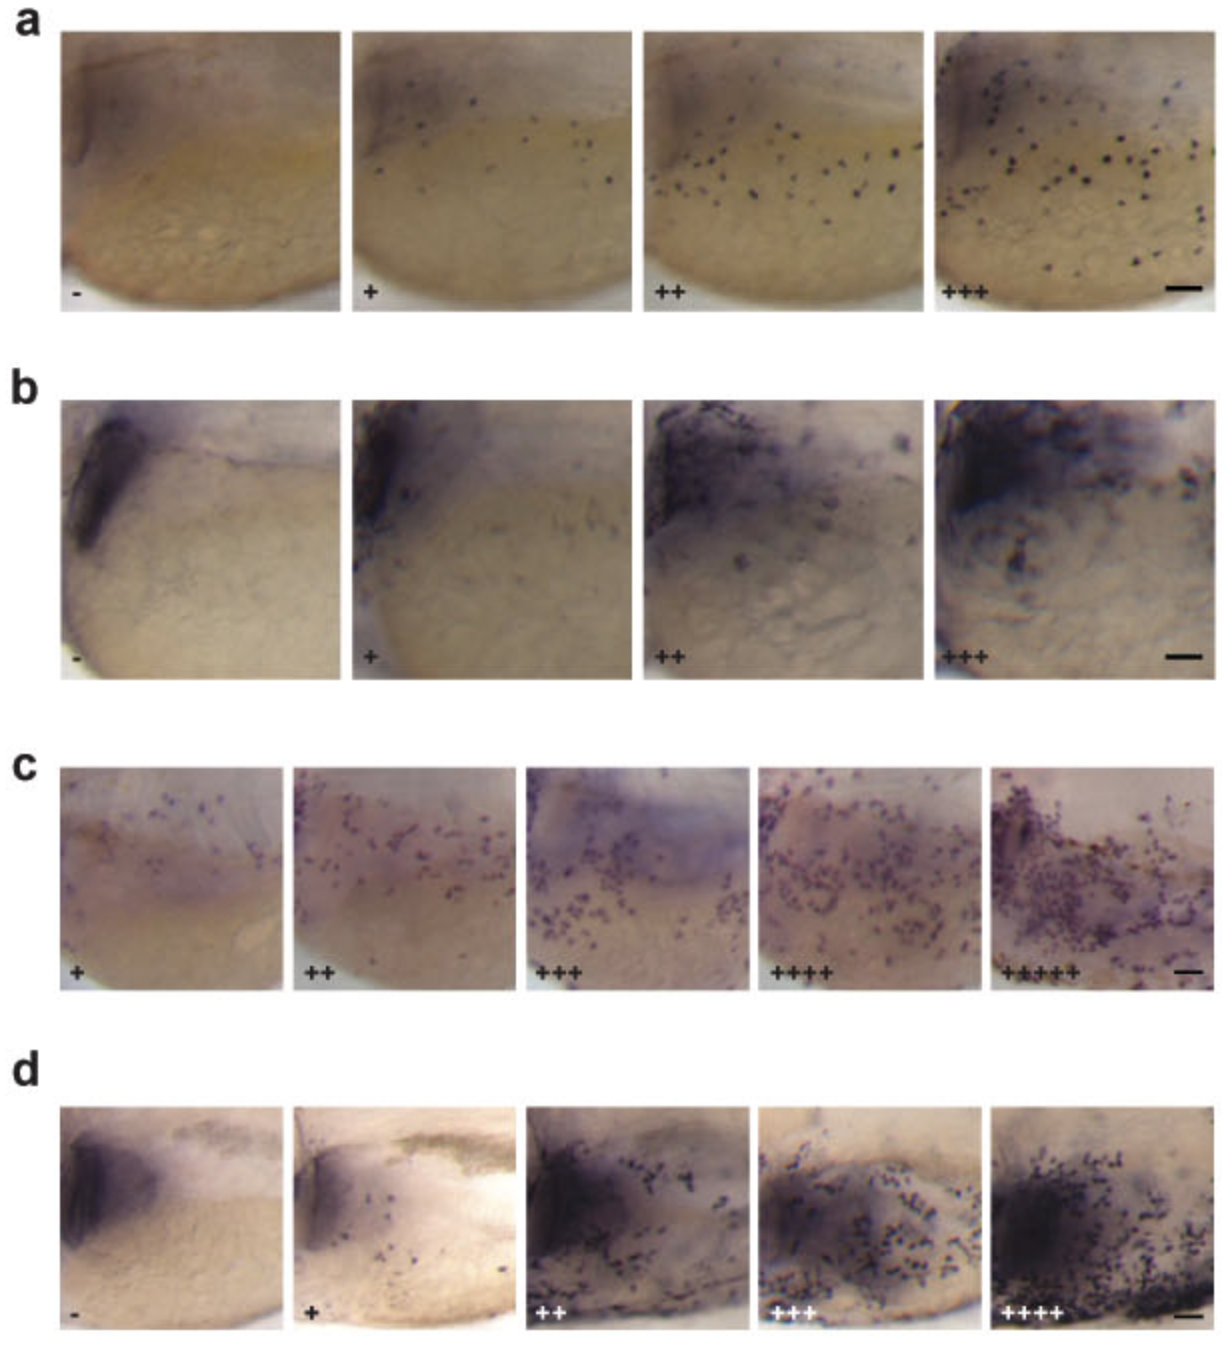
Fig. S1
The scoring system used in this study. (a) Four different levels of pAkt signal were observed in 80 hpf zebrafish larvae and used for quantification. (b) Four different levels of pErk signal were observed in 80 hpf zebrafish larvae and used for quantification. (c) Five different levels of NaR cell density were observed in 120 hpf larval skin analyzed by in situ hybridization for igfbp5a mRNA and used for quantification in this study. (d) Five different levels of pAkt signal observed in 120 hpf larvae and used for quantification. All images shown are lateral views of the yolk sac region with anterior to the left and dorsal up. Scale bar =50 μm.