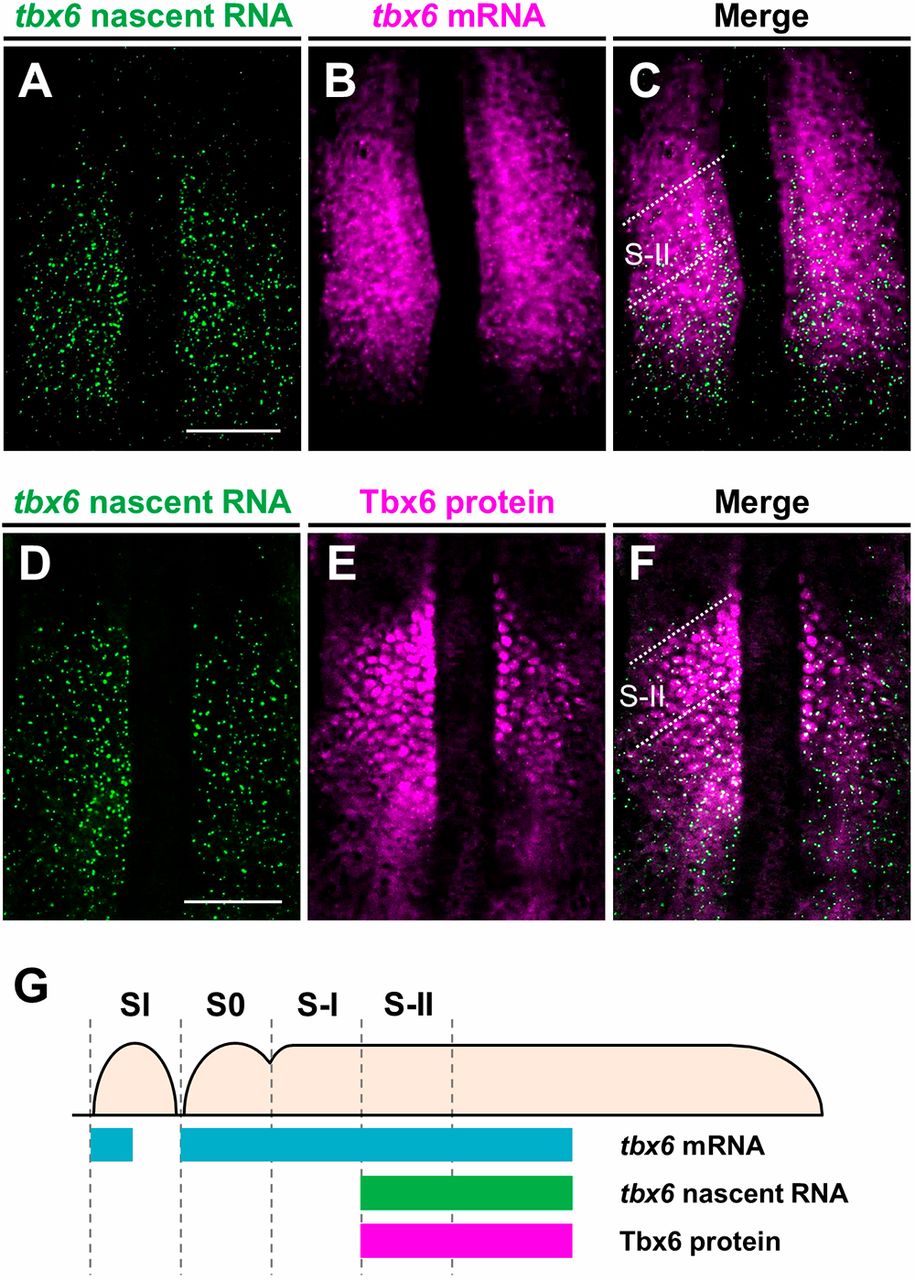
Fig. 1 The anterior border of the expression domain of tbx6 nascent transcripts overlaps with the anterior border of the Tbx6 domain in the anterior PSM of zebrafish embryos. (A-C) Two-color fluorescent in situ hybridization was performed to compare the expression patterns of de novo tbx6 RNA (green; A) and mature tbx6 mRNA (magenta; B) in the PSM of wild-type embryos at the 10- to 12-somite stage (n=4). (D-F) Distributions of tbx6 nascent transcripts (green; D) and Tbx6 proteins (magenta; E) in the PSM of wild-type embryos at the 10- to 12-somite stage (n=4). Flat-mounted specimens after yolk removal. Dorsal view; anterior is to the top. Scale bars: 100 µm. (G) Schematic illustrations showing the expression domains of tbx6 mRNA, tbx6 nascent RNA and Tbx6 protein in the PSM. The forming somites are designated S0 and the following prospective somites in the PSM are shown in negative roman numerals (Pourquié and Tam, 2001). Distribution of tbx6 mRNA and Tbx6 protein are depicted as described previously (Nikaido et al., 2002; Wanglar et al., 2014).
Image
Figure Caption
Figure Data
Acknowledgments
This image is the copyrighted work of the attributed author or publisher, and
ZFIN has permission only to display this image to its users.
Additional permissions should be obtained from the applicable author or publisher of the image.
Full text @ Development

