IMAGE

Figure 6

ID
ZDB-IMAGE-200905-23
Source
Figures for Sone et al., 2020
Image
Figure Caption

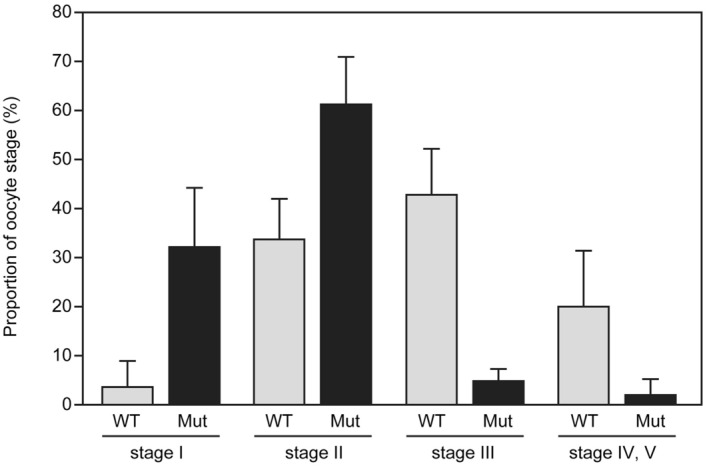
Figure 6

Distribution of the ddx5-deficient oocytes classified by oocyte maturation. Ovarian follicles from wild-type (n = 5) and mutant animals (n = 5) at 5 mpf were classified by diameter (stage I; 7–140 μm, stage II; 140–340 μm, stage III; 340–690 μm, stage IV, V; 690–750 μm). Fifty ovarian follicles from individual ovaries represent the proportion of oocyte stages. Error bars indicate standard deviation.

Acknowledgments
This image is the copyrighted work of the attributed author or publisher, and ZFIN has permission only to display this image to its users. Additional permissions should be obtained from the applicable author or publisher of the image. Full text @ Sci. Rep.