IMAGE

FIGURE 2

ID
ZDB-IMAGE-200818-2
Source
Figures for Okuda et al., 2020
Image
Figure Caption

FIGURE 2

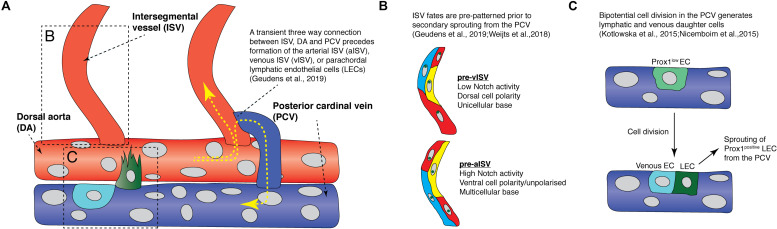
Recent findings from live imaging secondary angiogenesis/lymphatic sprouting in the zebrafish trunk. (A) Schematic diagram showing events that occur during secondary angiogenesis and anastomosis in the zebrafish trunk. Yellow arrows indicate direction of blood flow. Red vessels are arteries while blue vessels are veins. Light blue cell is a venous endothelial cell (EC) and the green cell is a fated lymphatic EC. (B) Schematic diagram illustrating the difference in Notch activity, cell polarity, and cell arrangements between future arterial intersegmental vessels and venous intersegmental vessels prior to secondary sprout anastomosis. (C) Schematic diagram showing how a Prox1-low EC (light green cell) in the posterior cardinal vein undergo bipotential cell division to give rise to a lymphatic EC (green cell) and a venous EC (light blue cell). aISV, arterial intersegmental vessel; DA, dorsal aorta; LEC, lymphatic endothelial cell; ISV, intersegmental vessel; PCV, posterior cardinal vein; vISV, venous intersegmental vessel.

Acknowledgments
This image is the copyrighted work of the attributed author or publisher, and ZFIN has permission only to display this image to its users. Additional permissions should be obtained from the applicable author or publisher of the image. Full text @ Front. Physiol.