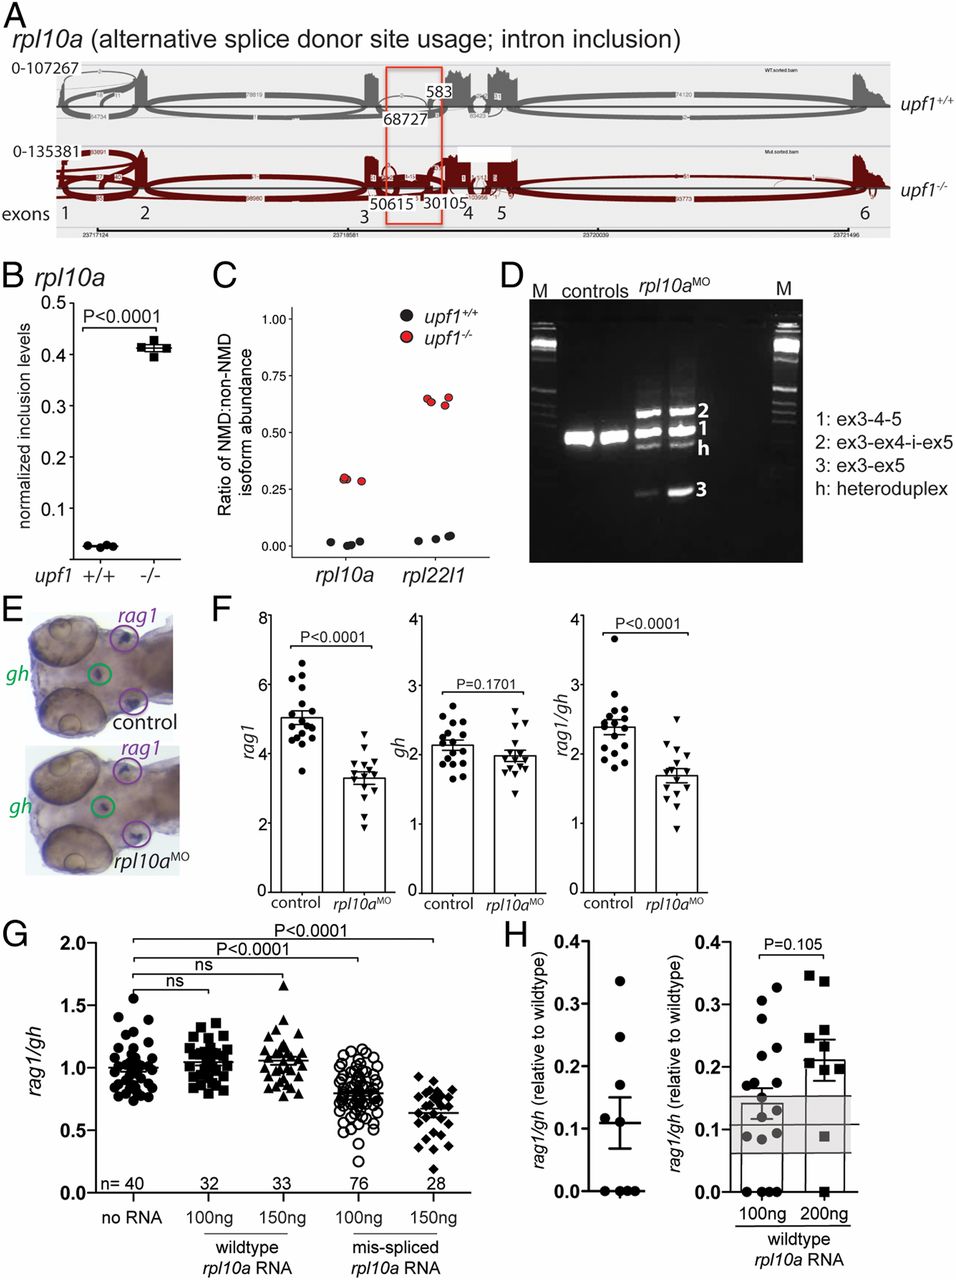
Fig. 5 Requirement of rpl10a for T cell development. (A) Increased alternative splice donor site usage downstream of exon 3 (boxed) of the rpla10a gene in upf1 mutants. The transcript identifier for the NMD transcript is ENSDART00000138427.3. (B) Inclusion levels of intronic sequences in wild-type and upf1 mutant fish. (C) Increased NMD/non-NMD ratios for rpl10a and rpl22l1 in upf1 mutants. Black circles, upf1+/+; red circles, upf1−/−. (D) Transcript structure in rpl10a morphants generated by blocking the splice donor site of exon 4 with a site-specific antisense oligonucleotide. The composition of cDNAs as determined by direct sequencing of amplicons is indicated. (E) Representative WISH result for rpl10a morphants in D. Each data point represents one fish; mean ± SEM. (Magnification: 15×.) (F) The thymopoietic capacity of rpl10a morphants was calculated from rag1 (Left), gh (Center), and expressed as rag1/gh ratios (Right). (G) Detrimental effect of misspliced rpl10a mRNA on T cell development in zebrafish larvae. After injection of the indicated amounts of the two relevant RNA isoforms (compare with A), the thymopoietic index was determined at 5 dpf. (H) Alleviation of impaired T cell development in upf1 mutant larvae after injection of wild-type rpl10a mRNA as determined at 5 dpf. The thymopoietic indices are shown for uninjected upf1 mutants (data from Fig. 1E) (Left) and upf1 mutants injected with two different amounts of RNA (Right). Each data point represents one fish; mean ± SEM.
Image
Figure Caption
Figure Data
Acknowledgments
This image is the copyrighted work of the attributed author or publisher, and
ZFIN has permission only to display this image to its users.
Additional permissions should be obtained from the applicable author or publisher of the image.
Full text @ Proc. Natl. Acad. Sci. USA

