Application of SpaOTsc to spatial transcriptomic data and their integrations with scRNA-seq datasets.
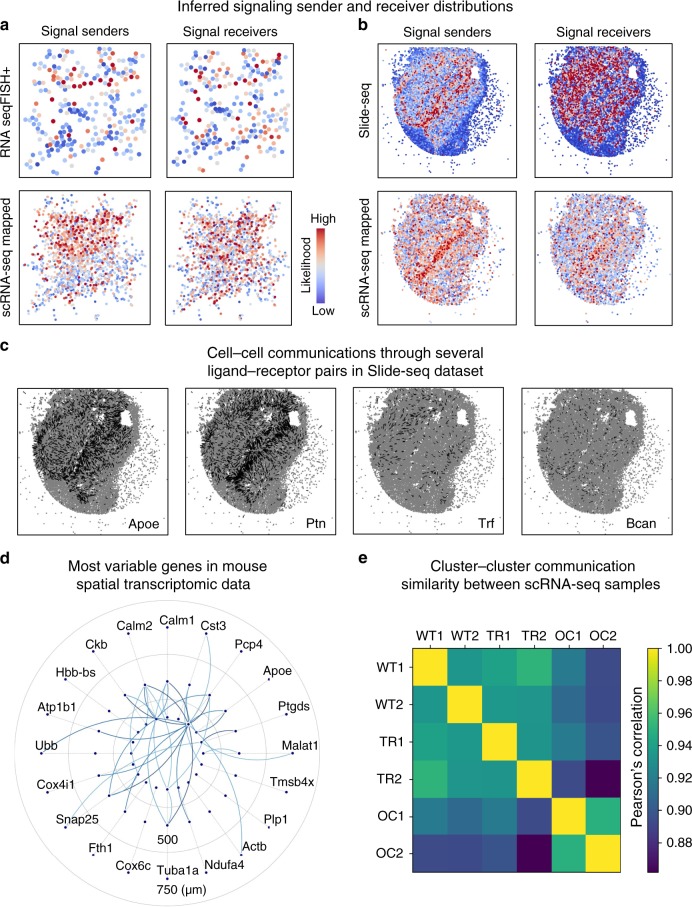
The Slide-seq data, the RNA seqFISH+ data, and the scRNA-seq data for mouse olfactory bulb were taken from ref. 51, ref. 52, and ref. 53, respectively. a, b Spatial distributions of signal senders and receivers with the color showing the likelihood of being a sender or receiver. Top row: inference using only spatial transcriptomics data. Bottom row: the inferred signaling in scRNA-seq data (sample WT1) visualized by mapping the single cells to space using spatial transcriptomic data. c Signaling for four individual marked ligands in the Slide-seq data. d The intercellular gene–gene regulatory information flow of the top 20 variable genes in the Slide-seq data. e Similarities on cluster–cluster communication between the six samples of the scRNA-seq data integrated with the RNA seqFISH+ data measured by Pearson’s correlation coefficient.
Acknowledgments
This image is the copyrighted work of the attributed author or publisher, and
ZFIN has permission only to display this image to its users.
Additional permissions should be obtained from the applicable author or publisher of the image.
Full text @ Nat. Commun.
Your Input Welcome
Thank you for submitting comments. Your input has been emailed to ZFIN curators who may contact you if
additional information is required.
Oops. Something went wrong. Please try again later.