IMAGE

Fig. 2

ID
ZDB-IMAGE-200730-10
Source
Figures for Hall et al., 2020
Image
Figure Caption

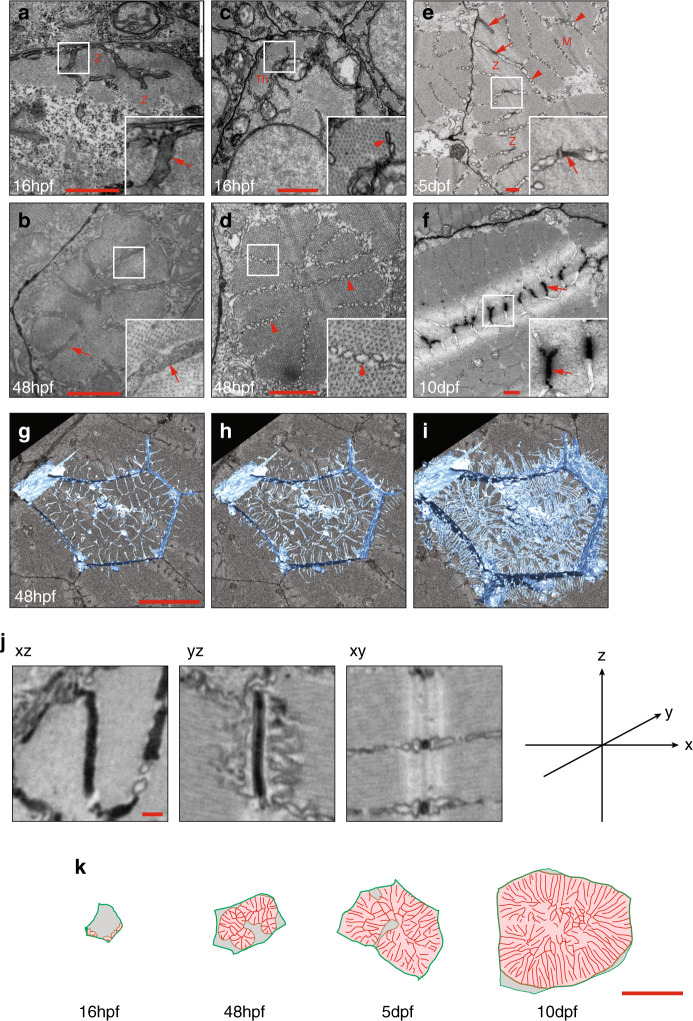
Fig. 2 Ultrastructure of T-tubule development.

af Transverse orientated transmission electron microscope (TEM) sections showing early T-tubules and sarcoplasmic reticulum. a, b Transverse sections through the Z line (Z) at 16 and 48 hpf. Electron dense, ferricyanide stained tubules are denoted by arrows. c, d Equivalent transverse sections taken towards the centre of the sarcomere, some distance from the Z-line. Arrowheads denote sarcoplasmic reticulum, which has an unstained lumen and a beaded appearance. e, f Oblique sections at 5 and 10 dpf show both ferricyanide stained, electron dense tubules (arrows) and sarcoplasmic reticulum (arrowheads). M, M-line, Z, Z-line. See also Supplementary Movie 3 (gi) TEM images were derived from two individual animals per time point and specific observations described were noted in >12 individual cells. Serial blockface electron microscopy and 3D reconstruction shows association of T-tubules with myofibril furrows or splits at level of the Z-line (see also Supplementary Movie 3). Images are derived from two individual animals and images shown are representative of both (j) Single planes from a focussed ion beam volume enables precise measurements of tubule morphometrics (quantitative data are shown in Fig. 3g). This analysis is derived from one individual. k Tracing of TEM images illustrates the architecture of myofibril furrows and associated tubules. Red, tubules/furrows; pink, myofibrils; green, sarcolemma. Full masks are shown in Fig. 3a–c. These analyses are derived from one individual per time point. Scale bars; (af) 1 µm, (g, h) 10 µm, (j) 200 nm, (k) 10 µm.

Acknowledgments
This image is the copyrighted work of the attributed author or publisher, and ZFIN has permission only to display this image to its users. Additional permissions should be obtained from the applicable author or publisher of the image. Full text @ Nat. Commun.