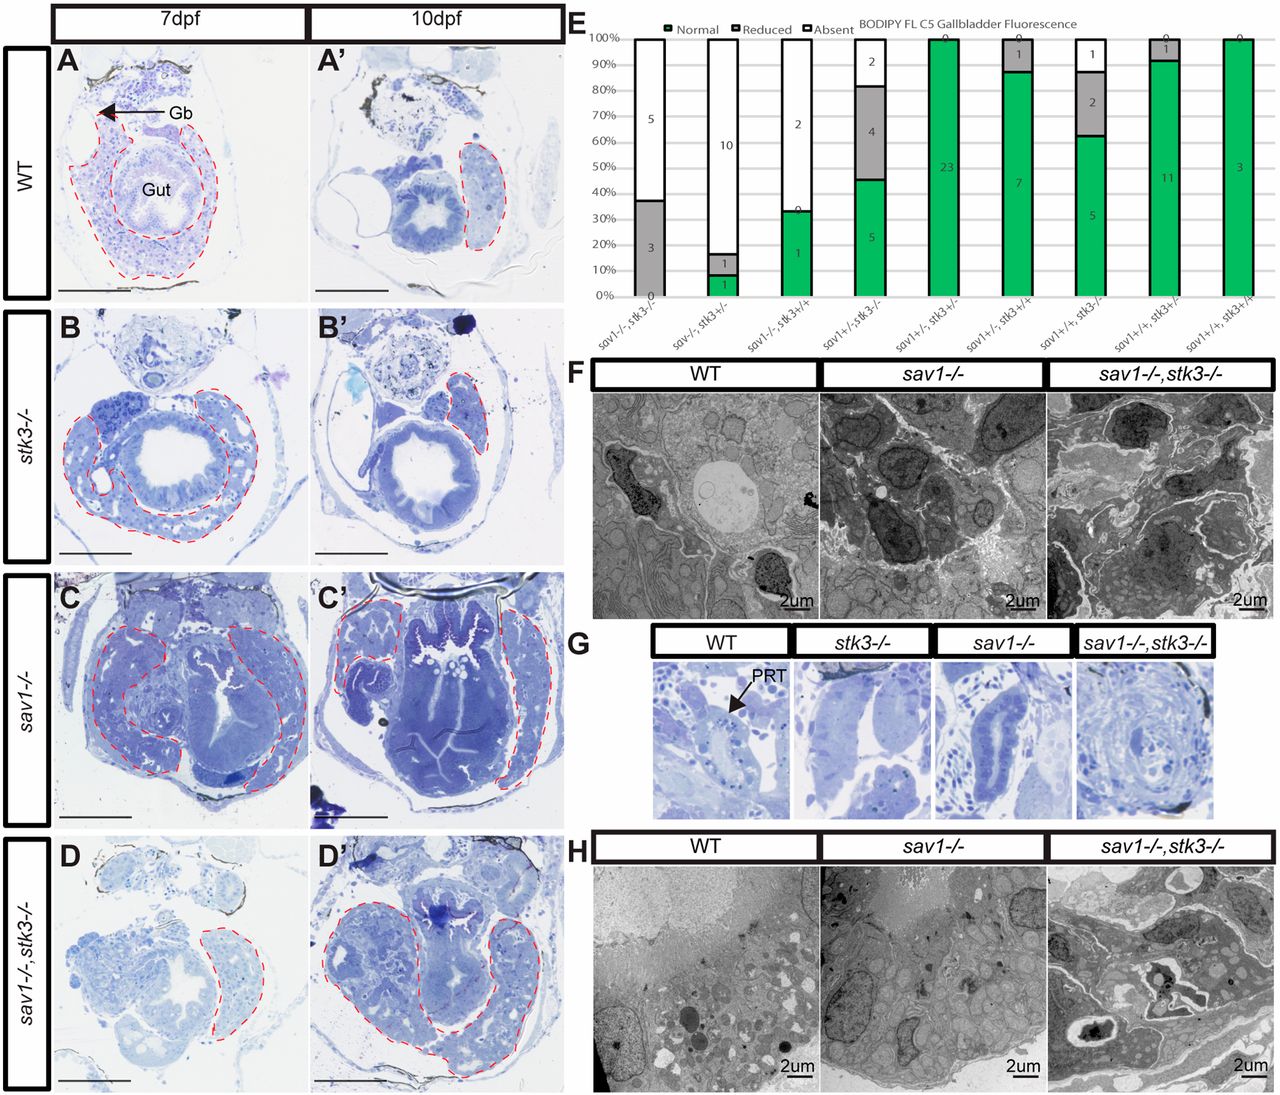
Fig. 11 sav1 and stk3 display a synergistic genetic interaction. (A-D′) Toluidine Blue stained Epon sections of liver and gallbladder in wild-type, sav1−/−, stk3−/− and sav1−/−;stk3−/− larvae at 7 and 10 dpf. Gb, gallbladder. Red dashed lines outline the liver. Scale bars: 100 μm. (E) Ratiometric analysis at 8 dpf of BODIPY FL C5 gallbladder uptake in larvae from a sav1+/−;stk3+/− incross. (F) TEM of wild-type, sav1−/− and sav1−/−;stk3−/− Epon sections at 10 dpf reveals the most severe phenotype in sav1−/−;stk3−/− larvae. (G) Toluidine Blue stained epon sections of proximal renal tubules in wild-type, sav1−/−, stk3−/− and sav1−/−;stk3−/− larvae at 10 dpf. PRT, proximal renal tubule. Only double mutants display a dysplastic and fibrotic phenotype. (H) TEM of larvae from G.
Image
Figure Caption
Figure Data
Acknowledgments
This image is the copyrighted work of the attributed author or publisher, and
ZFIN has permission only to display this image to its users.
Additional permissions should be obtained from the applicable author or publisher of the image.
Full text @ Development

