Spectral plots and cone contribution comparisons for 6BP+1 and 3BP larva.
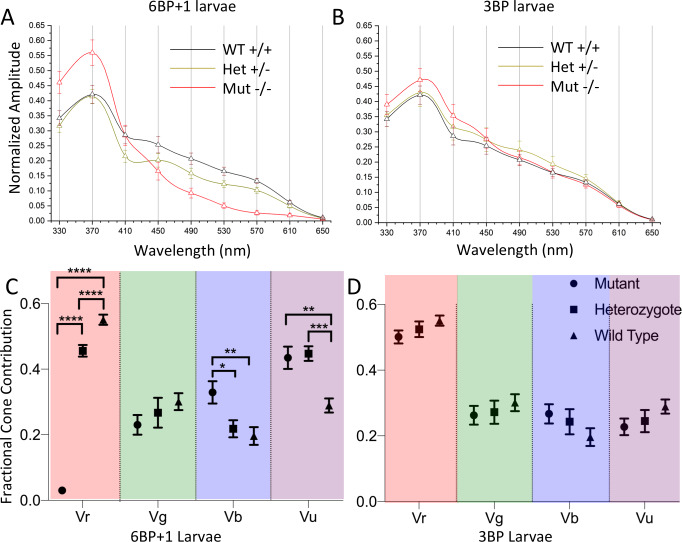
(A) Scanning from 330 nm to 650 nm with constant quantal irradiance (4.6 log(quanta∙μm−2∙s−1) the 6BP+1 mutant (N = 12) shows a large drop in response amplitude for long wavelengths and a strong preference for UV wavelengths compared to the wild type (N = 17) and heterozygote (N = 16). (B) The 3BP spectral plot shows a similar spectral pattern in response amplitude across the wavelengths between all genotypes. (C) The 6BP+1 mutant displays a significant drop in red cone contribution (Vr) accompanied by an increase in UV cone contribution (Vu). (D) The cone contribution comparisons between the 3BP genotypes show a trend towards decreasing Vr for the mutant and heterozygote as compared to wild type, though not significant. Spectral curves and fractional cone amplitudes in A-D are generated from the same datasets and model as in Fig 9.
This image is the copyrighted work of the attributed author or publisher, and
ZFIN has permission only to display this image to its users.
Additional permissions should be obtained from the applicable author or publisher of the image.
Full text @ PLoS Genet.
Your Input Welcome
Thank you for submitting comments. Your input has been emailed to ZFIN curators who may contact you if
additional information is required.
Oops. Something went wrong. Please try again later.