IMAGE

Fig 9

ID
ZDB-IMAGE-200718-36
Source
Figures for Deveau et al., 2020
Image
Figure Caption

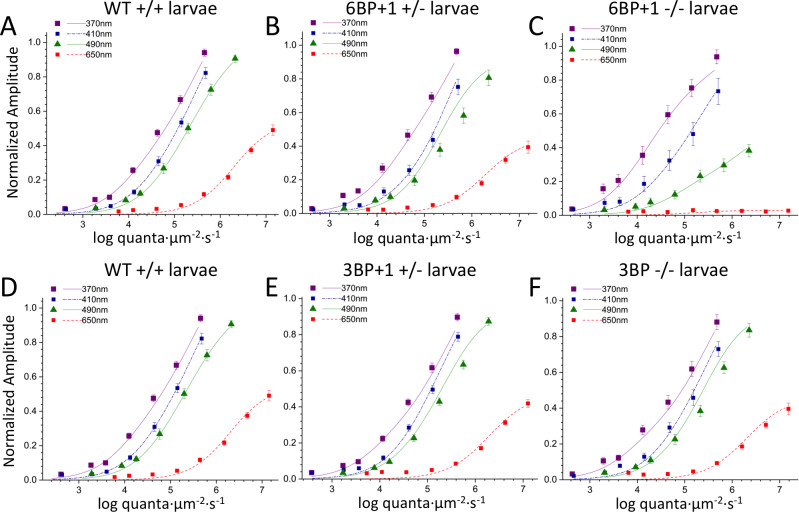
Fig 9 Irradiance plots: Change in amplitude of arval cone PIII ERG responses as a function of brightness and wavelength.

(A, B) The wild type (N = 17 datasets, 1190 points total) and 6BP+1 heterozygote (N = 16 datasets, 1120 points total) irradiance-amplitude curves are similar at 4 modeled wavelengths, while the 6BP+1 mutant (N = 12 datasets, 840 points total) (C) shows a loss of response to 650 nm that does not change even at higher irradiance levels. (D-F) Wild type (same as in A), 3BP heterozygote (N = 33 datasets, 2310 points total), and 3BP mutant (N = 17 datasets, 1190 points total) larvae are similar in their respective irradiance plots.

Figure Data
Acknowledgments
This image is the copyrighted work of the attributed author or publisher, and ZFIN has permission only to display this image to its users. Additional permissions should be obtained from the applicable author or publisher of the image. Full text @ PLoS Genet.