IMAGE

Figure 9

ID
ZDB-IMAGE-200711-11
Genes
Antibodies
Source
Figures for Sun et al., 2020
Image
Figure Caption

Figure 9

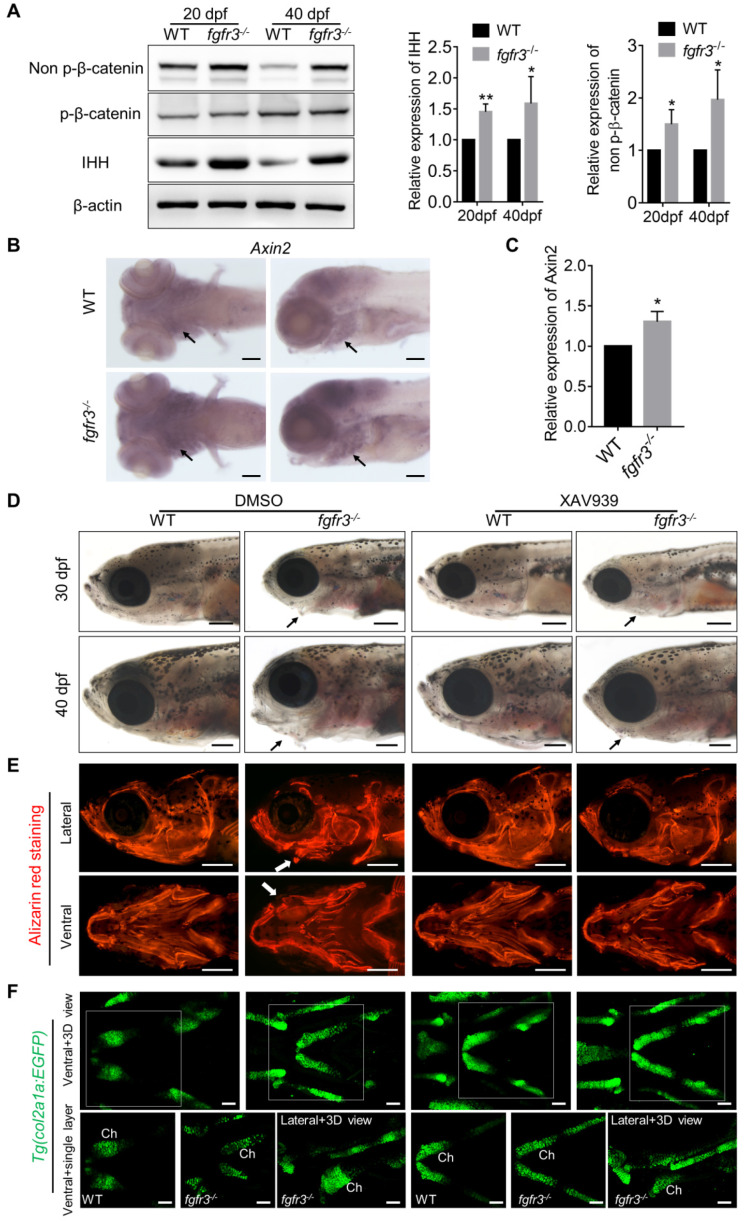
Fgfr3 mutation upregulates canonical Wnt/β-catenin signaling and Wnt inhibition partially alleviates the phenotype of fgfr3 mutants. (A) Western blot detecting the protein levels of phosphorylated-β-catenin, non-phosphorylated β-catenin (activated β-catenin) and IHH in WT and mutant zebrafish at 20 dpf (SL 7.5 mm) and 40 dpf (SL 13.0 mm), β-actin was used as loading control. Quantitative analyses of the relative expressions of IHH and non-phosphorylated β-catenin are show in the right panel. n = 3 independent experiments, **p < 0.01, *p < 0.05. (B) Expression level of axin2 examined by in situ hybridization at 7 dpf. Black arrows indicate pharyngeal cartilage. (C) RT-qPCR analysis of the expression level of axin2 at 20 dpf (SL 7.5 mm). n = 3 independent experiments, *p < 0.05. (D-F) WT and fgfr3 mutants treated with 2.5 µM XAV939 (right) or DMSO (left) from 10 dpf (SL 5.0 mm) to 20 dpf (SL 7.5 mm). (D) show the lateral view of head region detected by light microscopy at 30 dpf (SL 10.0 mm) (top) and 40 dpf (SL 13.0 mm) (bottom). Arrows indicate that the mandibular deformity with hyoid arch drooping toward the ventral side was partially rescued in XAV939-treated mutants. (E) show the lateral view (top) and ventral view (bottom) of craniofacial bone at 40 dpf (SL 13.0 mm) with living Alizarin red staining. (F) is the confocal images showing the ceratohyal cartilage (Ch) at 30 dpf (SL 10.0 mm) of WT and fgfr3 mutants in Tg (col2a1a:EGFP) transgenic background. Boxed regions in the 3D confocal image are showed the single layer in the bottom. Scale bar, 100 µm in C, 400 µm in D and E, 50 µm in F.

Figure Data
Acknowledgments
This image is the copyrighted work of the attributed author or publisher, and ZFIN has permission only to display this image to its users. Additional permissions should be obtained from the applicable author or publisher of the image. Full text @ Theranostics