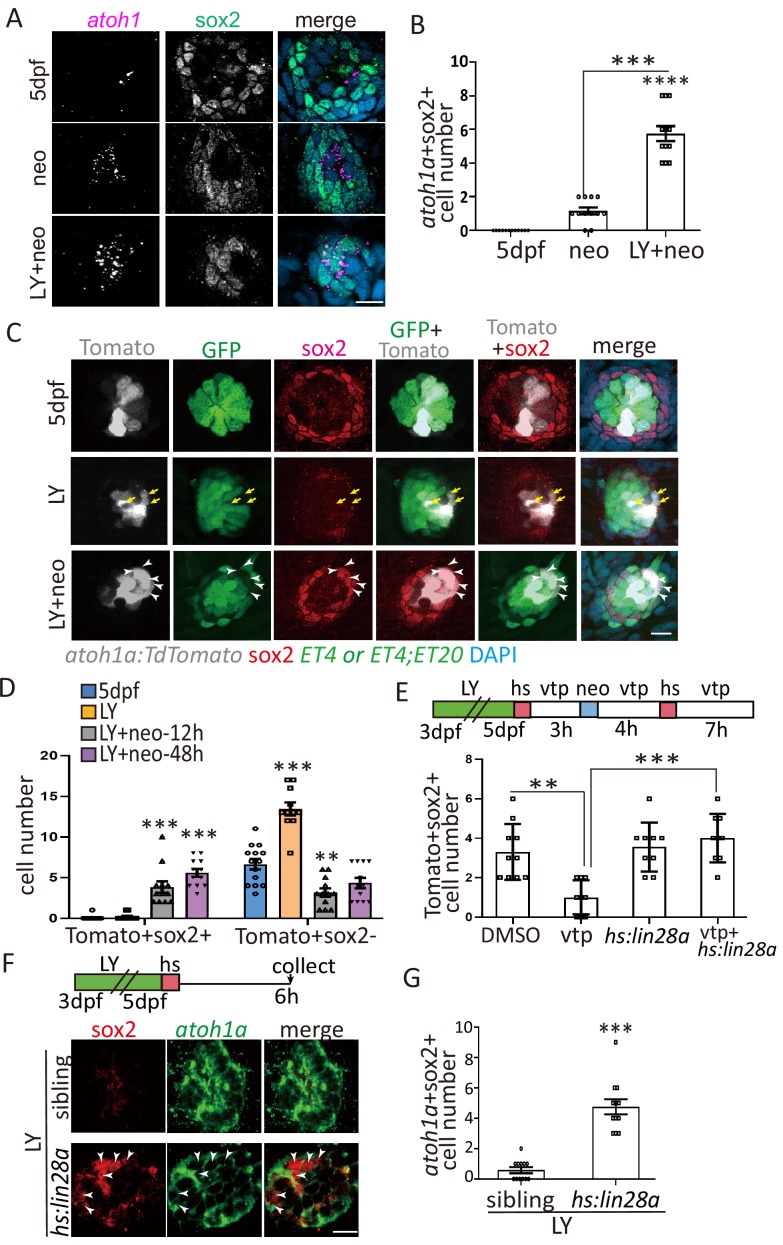
Figure 5 (A–B) Larvae were stained with sox2 antibody and atoh1a RNA probe at 6 hr post neo or LY+neo treatment. The number of atoh1a+sox2+ cells was significantly increased in LY+neo group. (C–D) The atoh1a:TdTomato larvae were used to trace atoh1a+ HC precursors in ctrl, LY or LY+neo. Results showed that Tomato+ cells labeled partial ET4+ HCs and ET4-sox2- HC precursors (yellow arrows). However, many atoh1a+ cells start to express sox2 from 12 hr post LY+neo and their numbers were significantly increased compared with normal larvae. The arrowheads in (C) pointed the atoh1a+sox2+ cells at 48 hr post LY+neo. (E) The atoh1a:TdTomato;hs:lin28a larvae was treated with LY+neo and verteporfin and collected for immunostaining with sox2 antibody. The cell number of Tomato+sox2+ is decreased in verteporfin and overexpression of lin28a could rescue the phenotype. (F–G) The LY-treated hs:lin28a larvae were heat-shocked to overexpress lin28a. Samples were collected for staining with sox2 antibody and atoh1a RNA probe. The number of atoh1a+sox2+ cells was significantly increased in hs:lin28a group, indicating that lin28a is sufficient to express sox2 in atoh1a+ HC precursors. Scale bar equals 10 μm.
Image
Figure Caption
Acknowledgments
This image is the copyrighted work of the attributed author or publisher, and
ZFIN has permission only to display this image to its users.
Additional permissions should be obtained from the applicable author or publisher of the image.
Full text @ Elife

