IMAGE

Fig. 1

ID
ZDB-IMAGE-200427-2
Source
Figures for Wu et al., 2020
Image
Figure Caption

Fig. 1

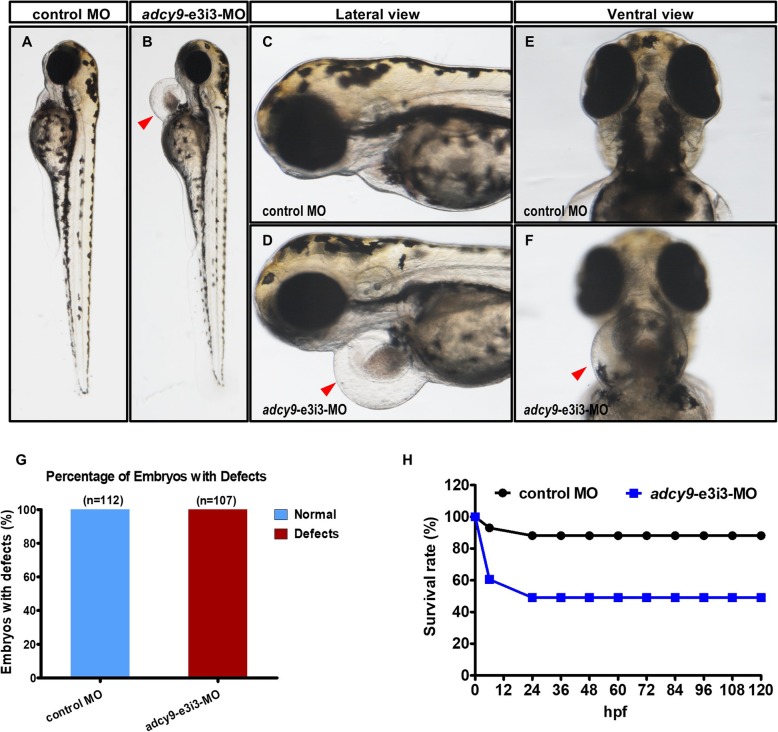
Phenotypes of adcy9 zebrafish morphants. (a-f) Gross morphology at 3-dpf. Compared with control MO, knock down adcy9 present pericardial oedema (b, d, f, red arrow) (Heart beat is visible in the control fish, but is abnormal in adcy9-e3i3-MO injected fish (Supplementary Movie 1, Supplementary Movie 2). The bar graph in Panel G shows the percentage of embryos with development defects. h A time-course plot of percent survival in control vs. adcy9 morphants for 5 days

Figure Data
Acknowledgments
This image is the copyrighted work of the attributed author or publisher, and ZFIN has permission only to display this image to its users. Additional permissions should be obtained from the applicable author or publisher of the image. Full text @ Orphanet J Rare Dis