
Fig. 6
|
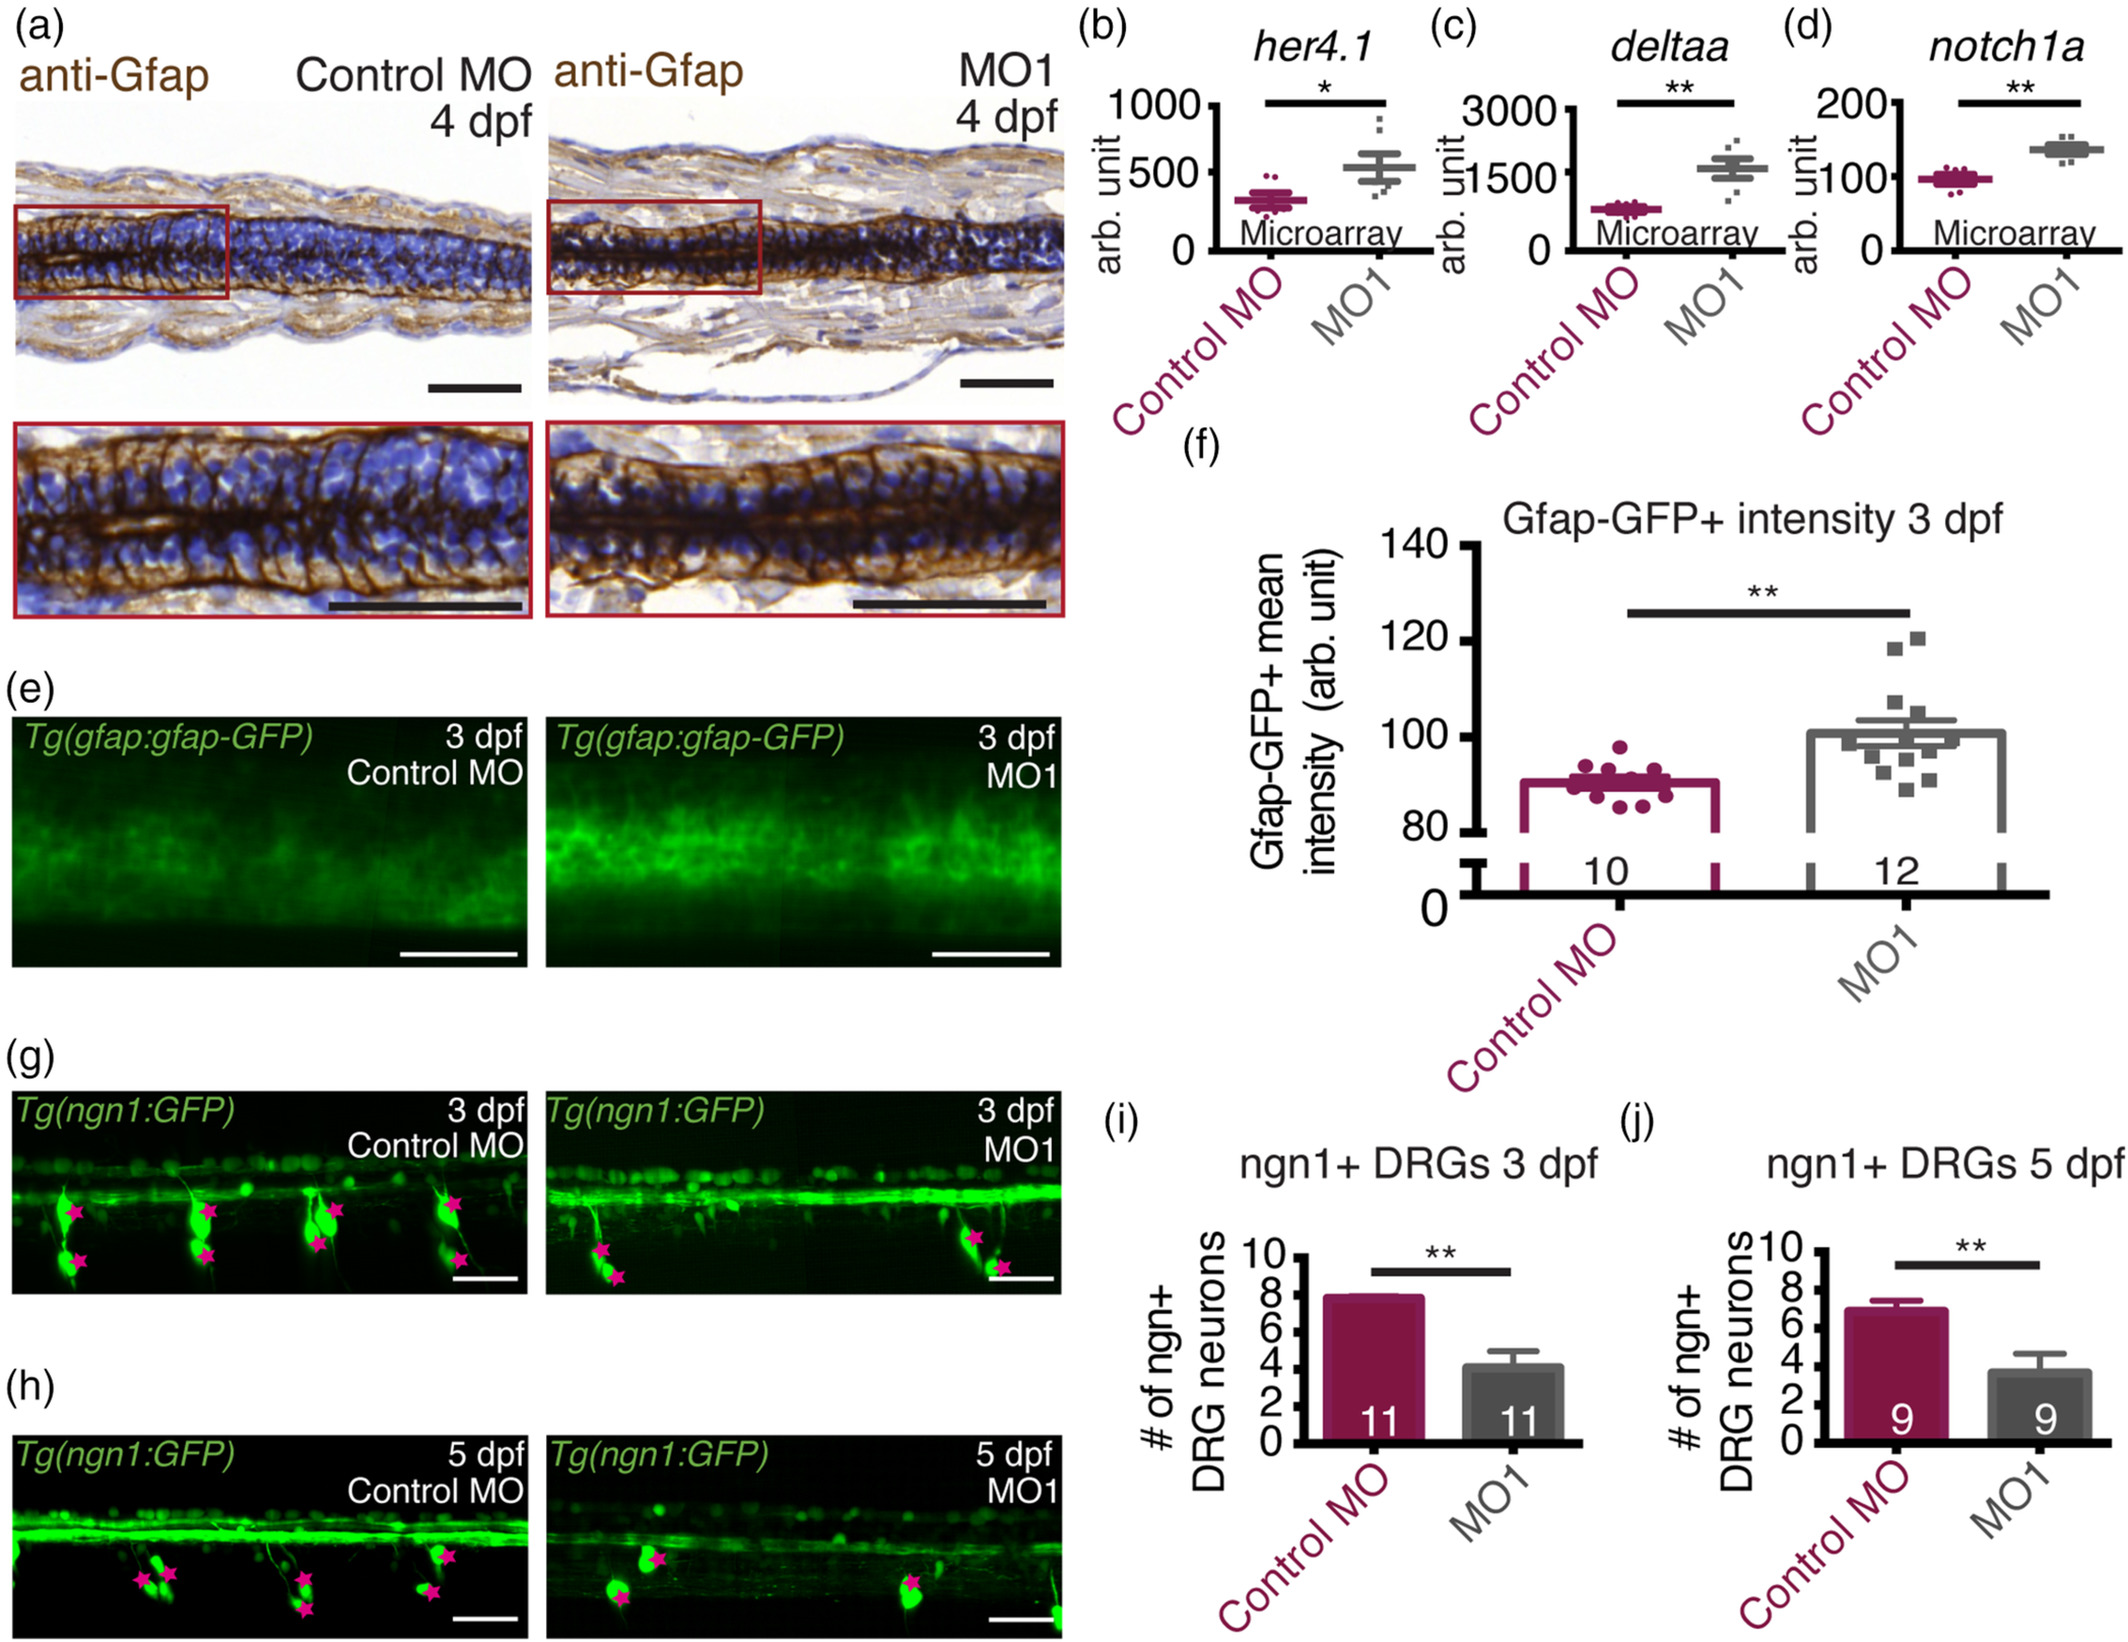
Fig. 6 36K knockdown zfl have up‐regulated Notch targets. (a) Representative images and enlarged selections (red squares) of sagittal paraffin sections depicting spinal cords of 4 dpf zfl injected with control MO and MO1; showing radial glial cells labeled with anti‐Gfap antibodies. Sections were counter stained with hematoxylin. Scale bars: 50 μm. (b–d) Microarray analysis at 3 dpf showing up‐regulation in MO1 of (b) her4.1 (c) deltaa and (d) notch1a. N = 6. Unpaired two tailed t test with Welch's correction. p‐value .043 (*) for her4.1 (b), p‐value .002 (**) for deltaa (c), p‐value .003 (**) for notch1a (d). (e) Representative lateral view of two spinal segments above the yolk extension in TgBAC(gfap:gfap‐GFP) zfl at 3 dpf injected with control MO and MO1. Scale bars: 40 μm. (f) Mean fluorescence intensity of gfap:gfap‐GFP in the spinal cord from average projections acquired from a z stack of 125 μm. Sample sizes: N = 4; n shown in each bar. Unpaired two tailed t test with Welch's correction p‐value .0032 (**). (g,h) Representative lateral view of four spinal segments above the yolk extension in Tg(‐8.4ngn1:GFP) zfl at (g) 3 dpf and (h) 5 dpf injected with control MO and MO1. Ngn + DRG cells are marked by pink stars. Scale bars: 40 μm. (i,j) Fewer ngn1+ DRG neurons in 4 spinal segments in MO1 zfl at (i) 3 dpf and (j) 5 dpf. Sample sizes: N = 3; n shown in each bar. For (i), Mann–Whitney two tailed test p‐value .0008 (***). For (j), Mann–Whitney two tailed test p‐value .02760 (*)