IMAGE

Figure 5

ID
ZDB-IMAGE-200406-212
Source
Figures for Bui Thi et al., 2020
Image
Figure Caption

Figure 5

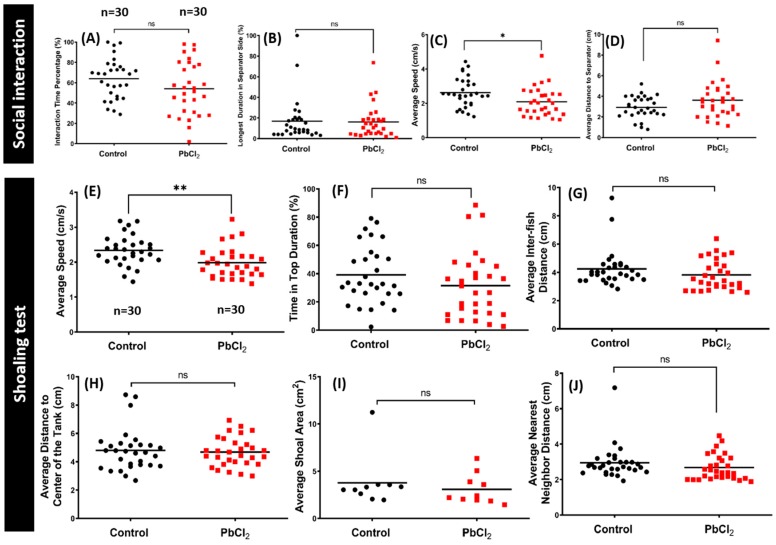
Comparison of the conspecific social interaction and shoaling between control and 50 ppb PbCl2-treated fish. After PbCl2 exposure, the conspecific social interaction was monitored and the data are presented as (A) interaction time percentage, (B) longest duration in the separator side, (C) average speed, and (D) average distance to the separator. The data are expressed as the mean values and analyzed by the Mann–Whitney test (n = 30; * p ≤ 0.05). For the shoaling test, after PbCl2 exposure, the shoaling behavior was monitored at 30 days post-treatment and the data are presented as (E) average speed, (F) time in the top duration, (G) average inter-fish distance, (H) average distance to the center of the tank, (I) average shoal area, and (J) average nearest neighbor distance. Data are expressed as the mean values and analyzed by the Mann–Whitney test (n = 30; ** p ≤ 0.01).

Acknowledgments
This image is the copyrighted work of the attributed author or publisher, and ZFIN has permission only to display this image to its users. Additional permissions should be obtained from the applicable author or publisher of the image. Full text @ Int. J. Mol. Sci.