IMAGE

Fig. 2

ID
ZDB-IMAGE-200307-2
Source
Figures for Horstick et al., 2020
Image
Figure Caption

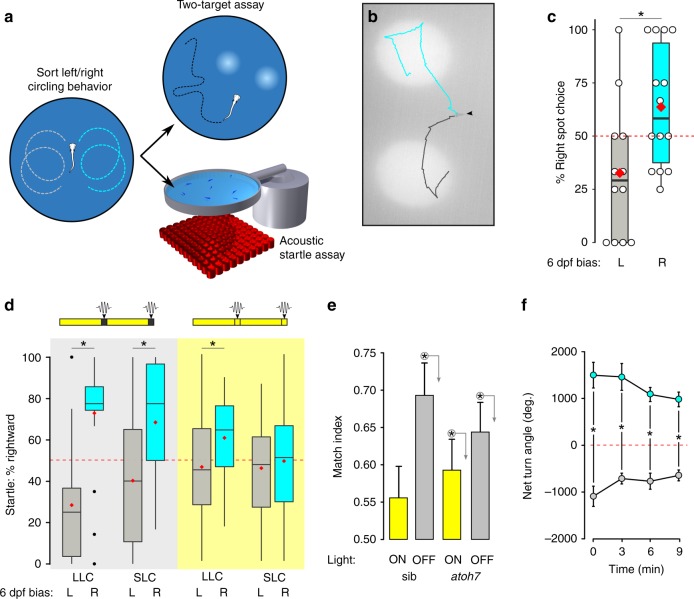
Fig. 2 Motor asymmetry is correlated across multiple behavioral tasks.

a Experimental paradigm: larvae were classified as left-/right-biased at 6 dpf based on circling response after loss of illumination (over 4 trials). At 7 dpf, the same larvae were tested in either a two-target phototaxis assay or acoustic startle assay. b Representative path trajectories for right- (cyan) and left- (gray) classified larvae (arrowhead) presented with two symmetric light spots following loss of illumination. c Percent of trials on which larvae turned toward the right spot, for larvae classified at 6 dpf as left-biased (gray, N = 12) and right-biased (cyan bar, N = 13). Each larva performed four trials, with trials excluded if the larva was adjacent to the arena edge when light spots were presented. Asterisk p < 0.05, r = 0.51, Mann–Whitney U test. d Percentage of startle responses made in a rightward direction for larvae preclassified as left- (gray) or right- (cyan) biased. Larvae were tested either in the dark (gray background) or light (yellow background) conditions. As acoustic stimuli elicit either short- or long-latency C starts (SLC, LLC) that are mediated by different circuits, response types were analyzed separately. Red diamond indicates mean. Dark LLC responses: left N = 19, right N = 20. Dark SLC responses: left N = 12, right N = 14; light LLC responses: left N = 27, right N = 23; light SLC responses: left N = 18, right N = 28. Asterisk p < 0.05, r = 0.71, 0.51, and 0.35, respectively, Mann–Whitney U test. e Match index for atoh7 mutants and siblings during baseline illumination (sib, N = 45; mutant, N = 57; yellow bars) and dark conditions (sib, N = 51; mutant, N = 58; gray bars). Asterisk p < 0.05, r = 0.74, 0.20, and 0.41, respectively, one-sample permutation test to 0.5. f NTA for each of four trials after unilateral enucleation of the left (gray, N = 4) or right (cyan, N = 6) eye. Dotted red line: random output. Repeated measures ANOVA, the effect of side-lesioned, F1,7 = 115.8, p < 0.001, η2p = 0.94. Asterisk p < 0.05 between groups. Error bars represent standard error of the mean. Box plots show median and quartiles with whiskers indicating 10–90%. Source data are provided as a Source Data file.

Acknowledgments
This image is the copyrighted work of the attributed author or publisher, and ZFIN has permission only to display this image to its users. Additional permissions should be obtained from the applicable author or publisher of the image. Full text @ Nat. Commun.