
|
Figure 3
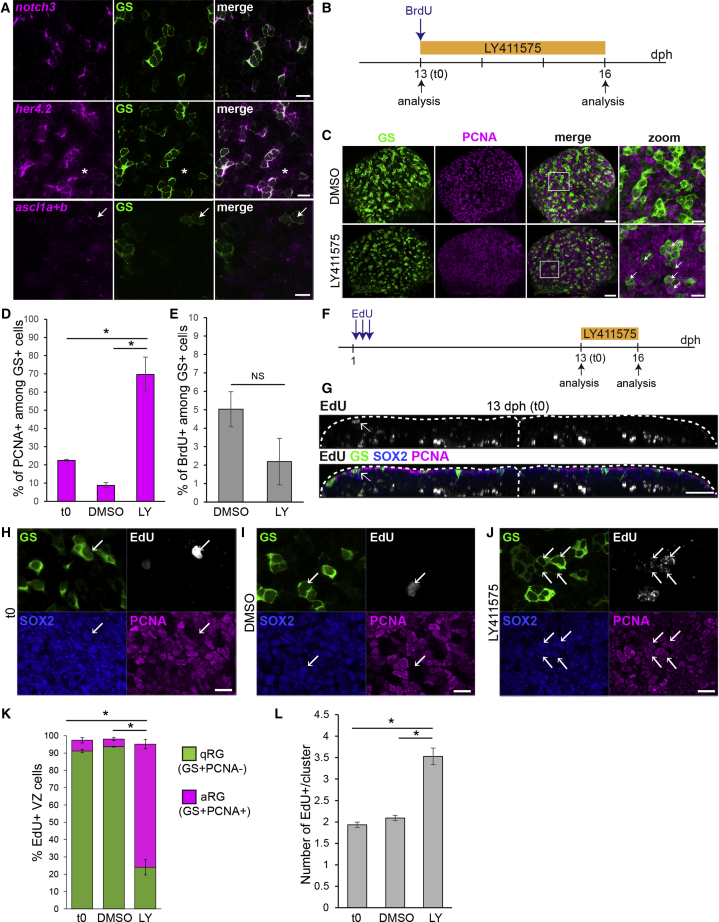
Killifish RG Enter in a Notch3-Dependent Quiescent State
(A) ISH for
(B) Experimental design for the data shown in (C)–(E).
(C) Double immunostaining for GS (green) and PCNA (magenta) in DMSO control (top) and LY-treated (bottom) brains, illustrating the increase in PCNA+ RG cells (white arrows). Images on the right are high magnifications of the pallial surface. Scale bars, 30 μm (left) and 10 μm (right).
(D) Proportion of PCNA+ cells among GS+ RGs before and after DMSO or LY treatment.
(E) Proportion of BrdU-labeled cells among RG after DMSO or LY treatment
(F) Experimental design for the data shown in (G)–(L).
(G) Immunostaining for GS (green), Sox2 (blue) and PCNA (magenta), and EdU detection (gray) at the end of the chase (13 dph, t0). A 2 μm transverse section through a 3D reconstruction is shown. Arrows point to EdU+ RG cells at the ventricle.
(H–J) Examples of EdU+ RG clusters observed at t0 (H), in control conditions (I), and after LY treatment (J). Optical z-planes showing immunostaining for GS (green), Sox2 (blue) and PCNA (magenta), and EdU detection (cyan) on the high magnification of the pallial surface are shown. Arrows point to EdU+ RG. Scale bar, 10 μm.
(K) Proportion of EdU-labeled cells that are quiescent RGs (qRGs) (green, Sox2+GS+PCNA−) or activated RGs (aRGs) (purple, Sox2+GS+PCNA+). Only EdU+ cells located close to the ventricular zone (VZ) were considered for this analysis.
(L) Average number of EdU+ cells inside each cluster of EdU+ cells.
∗Corrected p value < 0.05; one-way ANOVA, followed by pairwise comparisons using Holm’s procedure. Data were rank transformed prior to analysis. Data are represented as mean ± SEM; n = 3 for each treatment condition. See also