IMAGE

Fig. 1

ID
ZDB-IMAGE-200306-104
Genes
Source
Figures for Asakawa et al., 2020
Image
Figure Caption

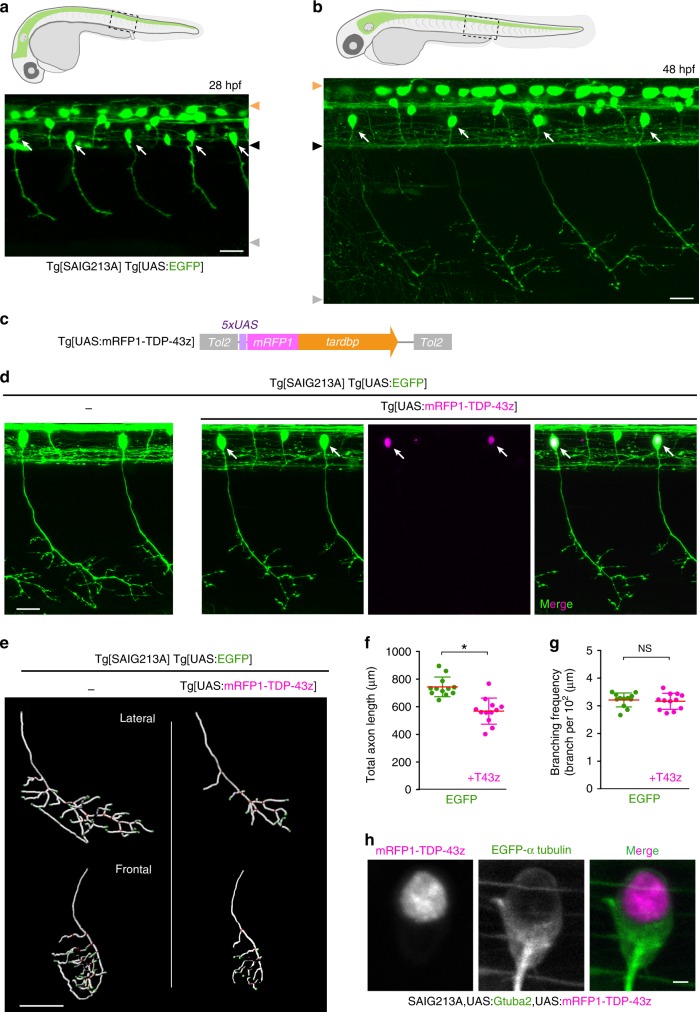
Fig. 1 TDP-43 overexpression halts axon outgrowth independently of cytoplasmic aggregation.

a, b CaPs (arrows) in Tg[SAIG213A] Tg[UAS:EGFP] fish. Orange, black and gray arrowheads indicate dorsal and ventral limits of the spinal cord, and ventral myotomal borders, respectively. c The structure of Tg[UAS:mRFP1-TDP-43z. d CaPs in Tg[SAIG213A] Tg[UAS:EGFP] (left) and Tg[SAIG213A] Tg[UAS:EGFP] Tg[UAS:mRFP1-TDP-43z] (right) larvae at 48 hpf. Arrows indicate CaPs expressing mRFP1-TDP-43z. e The lateral and frontal views of skeletonized CaP axons of Tg[SAIG213A] Tg[UAS:EGFP] (left) and Tg[SAIG213A] Tg[UAS:EGFP] Tg[UAS:mRFP1-TDP-43z] (right). The axon branch points and terminals are indicated by red and green, respectively. (See also Supplementary Movie 1). f, g Total length and branching frequency of CaP axons at the spinal segment 14–17 of Tg[SAIG213A] Tg[UAS:EGFP] (green, 12 cells, 5 animals) and Tg[SAIG213A] Tg[UAS:EGFP] Tg[UAS:mRFP1-TDP-43z] (magenta, 12 cells, 6 animals). *p < 0.0001 (unpaired t-test, two-tailed). NS, not statistically significant (p = 0.66). h Localization of mRFP1-TDP-43z in a CaP of Tg[SAIG213A] Tg[UAS:Gtuba2] Tg[UAS:mRFP1-TDP-43z] at 48 hpf. EGFP-tagged α-tubulin expressed from Tg[UAS:Gtuba2]64 serves as a marker for the cytoplasm. The bars indicate 20 µm (a, b, d), 40 µm (e), and 2 µm (h). Error bars show standard deviation (SD).

Figure Data
Acknowledgments
This image is the copyrighted work of the attributed author or publisher, and ZFIN has permission only to display this image to its users. Additional permissions should be obtained from the applicable author or publisher of the image. Full text @ Nat. Commun.