IMAGE

Figure 4

ID
ZDB-IMAGE-200302-38
Source
Figures for Stirling et al., 2020
Image
Figure Caption

Figure 4

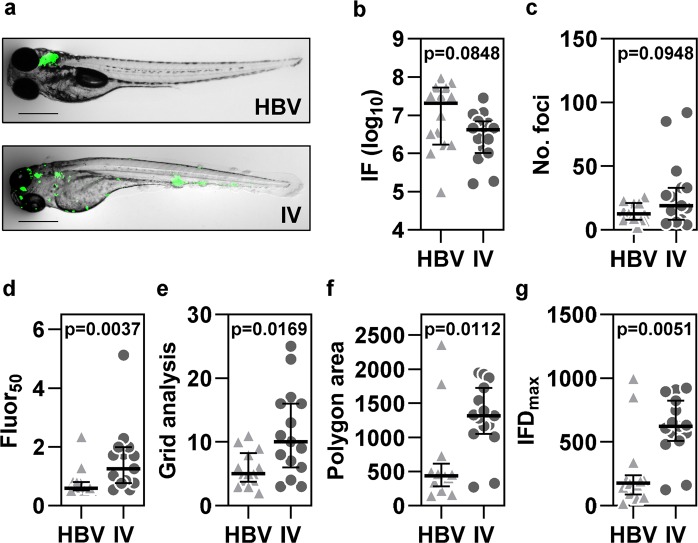
Comparison of localised and systemic Mycobacterium marinum (Mm) infection. (a) Representative images are shown for zebrafish larvae four days after either localised hindbrain ventricle (HBV) infection (n = 14) or systemic intravenous (IV) infection (n = 15) with 100 cfu Mm. Scale bars, 500 µm. Existing outcome measures, integrated fluorescence (IF), a surrogate for total bacterial burden (b) and the number of fluorescent bacterial foci (c) and dissemination parameters, fluor50 (d), grid analysis (e), polygon area (f) and IFDmax (g) are presented. Data points represent individual zebrafish larvae. Lines and error bars represent median ± IQR. p values were derived from Mann-Whitney tests. Data are representative of three independent experiments. See also Supplementary Fig. S7.

Acknowledgments
This image is the copyrighted work of the attributed author or publisher, and ZFIN has permission only to display this image to its users. Additional permissions should be obtained from the applicable author or publisher of the image. Full text @ Sci. Rep.