|
Fig 5
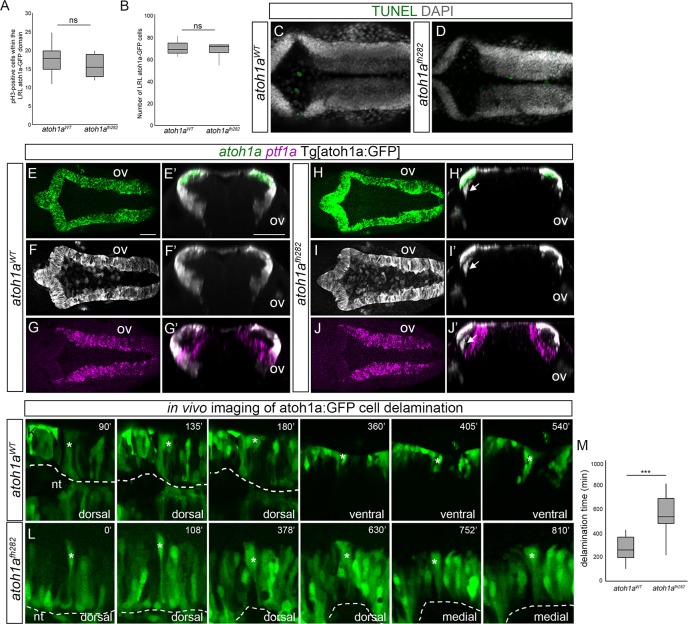
A-B) Box-plots with the quantification of mitotic figures within the LRL atoh1a:GFP cells (A), and the total number of LRL atoh1a:GFP cells (B), in

|
|
Fig 5
A-B) Box-plots with the quantification of mitotic figures within the LRL atoh1a:GFP cells (A), and the total number of LRL atoh1a:GFP cells (B), in