
|
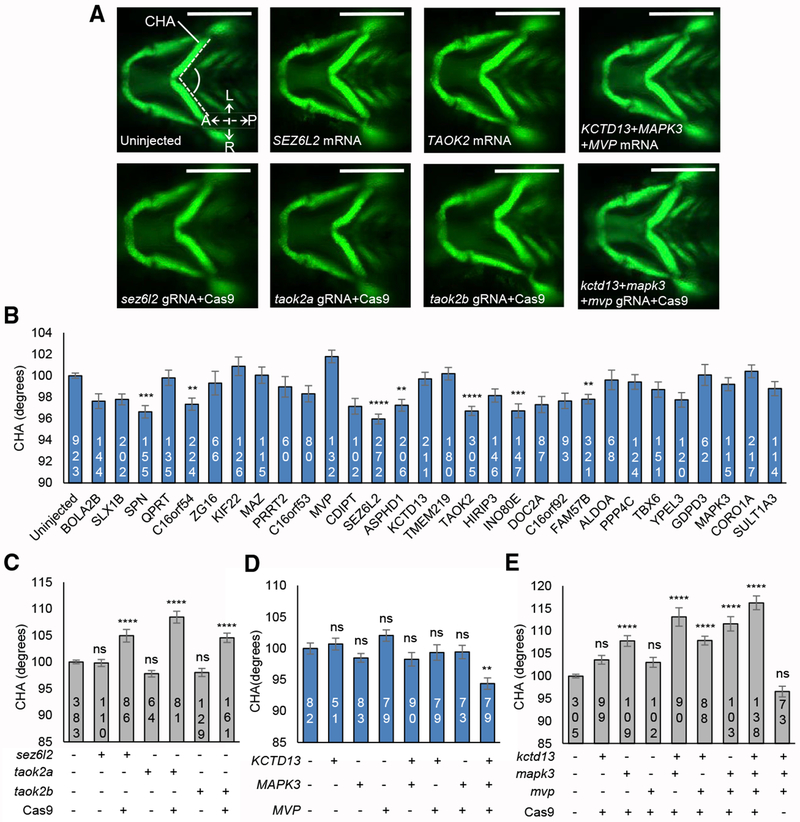
Fig. 5
(A) Representative ventral images of −
(B) Quantitative assessment of the CHA of larvae injected with single human mRNAs for each of the 30 genes located in the 16p11.2 BP4-BP5 region. Images were measured as shown in (A) (angle between dashed lines). Seven transcripts induced a significant reduction in CHA after Tukey’s p value adjustment (adjusted p < 0.01). Dosage is 12.5 pg for
(C) Quantitative assessment of the CHA of F0 mutant batches injected with single combinations of each of
(D) Quantitative assessment of the CHA of larvae injected with single or equimolar combinations of human
(E) Quantitative assessment of the CHA of F0 mutant batches injected with single or equimolar combinations of