
|
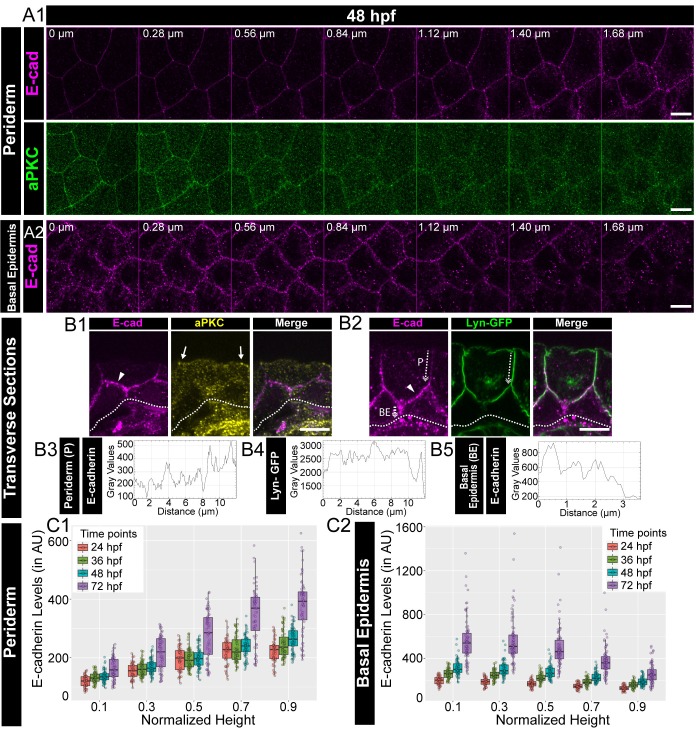
Figure 1 Confocal images of the periderm (A1) and basal epidermis (A2) showing localisation of E-cadherin (magenta) and aPKC (green) along various cell-heights at 48hpf in wild type embryos. Note 0 µm is the apical most section in both periderm as well as in the basal epidermis. Transverse sections of the epidermis covering the eye showing localisation of (B1) E-cadherin (magenta) and aPKC (yellow) and (B2) E-cadherin (magenta) and Lyn-GFP (green). Dotted arrows mark the cell boundary (B2) used for line intensity profiles for E-cadherin (B3) and Lyn-GFP (B4) in the Periderm (P) and for E-cadherin (B5) in Basal epidermis (BE). Quantification of E-cadherin levels along apicobasal axis at the normalised cell heights in the periderm (C1) and the basal epidermis (C2) at different developmental time points. Arrowheads in B1 and B2 point to maximum levels of E-cadherin at the interface of the two layers. Solid arrows in B1 point to aPKC localisation. Dotted lines mark the base of the epidermis. Scale bar is equivalent to 10 µm (A1, A2, B1, B2). AU = Arbitrary Units. Source file with fluorescence intensities for periderm and basal epidermis is available as Figure 1—source data 1 and 2 respectively.