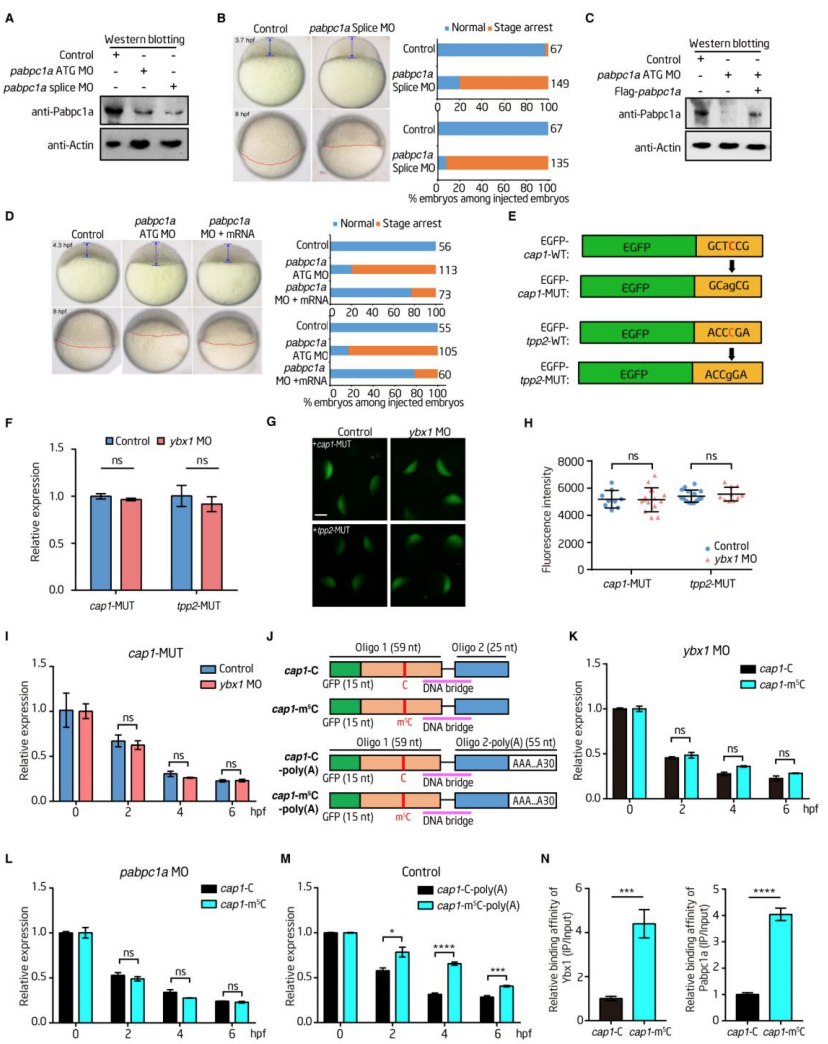
Fig. S5
(A) Western blotting of Pabpc1a showing the knockdown efficiency of two different MOs (the ATG MO and the Splice MO). Actin served as a protein loading control. 12 (B) Time-matched images of embryos showing the effects of the pabpc1a Splice MO on early development. Left; representative images of embryos; right: histogram. The numbers on the x-axis and to the right of each bar indicate the embryo count with the same morphological characteristics as the presented images and the total number of embryos used for the experiment, respectively. (C) Western blots showing the knockdown efficiency of the Splice MO and the overexpression efficiency achieved with Flag-pabpc1a mRNA. Actin served as a protein loading control. (D) Zebrafish embryo images and histogram displaying the attenuating effect of coinjection of the pabpc1a ATG MO and pabpc1a mRNA during the blastula or gastrula period. Left; representative images of embryos; right: histogram. The numbers on the x-axis and to the right of each bar indicate the embryo count with the same morphological characteristics as the presented image and the total number of embryos used for the experiment, respectively. (E) Schematic representation of four minigene constructs based on the pCS2-EGFP backbone. pCS2-EGFP-cap1-WT contains one m5C site (Cyt1267 from the start codon AUG) (EGFP-cap1-WT). Ser423 (UCC) was synonymously mutated to Ser423 (agC) to generate EGFP-cap1-MUT. pCS2-EGFP-tpp2-WT contains one m5C site (Cyt830 from start codon AUG) (EGFP-tpp2-WT). Pro280 (CCC) was synonymously mutated to Pro280 (CCg) to generate the tpp2-MUT construct. (F) The in vivo degradation of cap1-MUT and tpp2-MUT mRNAs was not affected by ybx1 deficiency. mRNA abundance was determined by qRT-PCR. Error bars, mean ± SD, n = 3. ns, not significant with p < 0.05, two-tailed Student’s t-test. (G and H) Representative images (G) and quantification (H) of the relative expression levels of the MUT products of cap1 and tpp2 in embryos with or without ybx1 deficiency at the sphere stage of development. The cap1-MUT and tpp2-MUT GFP reporter mRNAs produced comparable GFP protein levels in ybx1 morphants versus control embryos. Scale bar: 500 m. Error bars, mean ± SD, n = 9-14. ns, not significant with p < 0.05, two-tailed Student’s t-test. (I) qRT-PCR results showing the expression of the cap1-MUT reporter RNA in control 13 embryos and ybx1 morphants at indicated time points during the MZT. mRNA abundance was determined by qRT-PCR and normalized to the values at 0 hpf. -Actin served as an internal RNA control. Error bars, mean ± SD, n = 3. ns, not significant with p < 0.05, two-tailed Student’s t-test. (J) Schematic representation of the newly synthesized reporter RNAs based on cap1 mRNA. The first oligo (Oligo 1) contains 15 nt of GFP sequence and 44 nt of cap1 RNA with or without an m5C modification site. Oligo 2-poly(A) contains a 30 nt poly(A) tail. Oligo 1, Oligo 2 and Oligo 2-poly(A) were synthesized in vitro and ligated through splint ligation with DNA bridge oligos as templates. (K and L) qRT-PCR results showing the expression of the cap1- m5C (cyan) and cap1- C (black) reporter RNAs in embryos with ybx1 (K) or pabpc1a (L) at the indicated time points during the MZT. RNA abundance was determined by qRT-PCR and normalized to the value at 0 hpf. -Actin served as an internal RNA control. Error bars, mean ± SD, n = 3. ns, not significant with p < 0.05, two-tailed Student’s t-test. (M) qRT-PCR results showing the expression of the cap1- m5C-poly(A) (cyan) and cap1-C-poly(A) (black) reporter RNAs in control embryos at the indicated time points during the MZT. RNA abundance was determined by qRT-PCR and normalized to the value at 0 hpf. -Actin served as an internal RNA control. Error bars, mean ± SD, n = 3. *p < 0.05, ***p < 0.001, ****p < 0.0001, two-tailed Student’s t-test. (N) RIP-qPCR analysis results showing the binding affinities of Ybx1 (left) and Pabpc1a (right) for the m5C-modified (cyan) and unmodified control (black) reporter RNAs. Error bars, mean ± SD, n = 3. ***p < 0.001, ****p < 0.0001, two-tailed Student’s t-test

