IMAGE

Fig 2

ID
ZDB-IMAGE-191230-973
Source
Figures for Walter et al., 2019
Image
Figure Caption

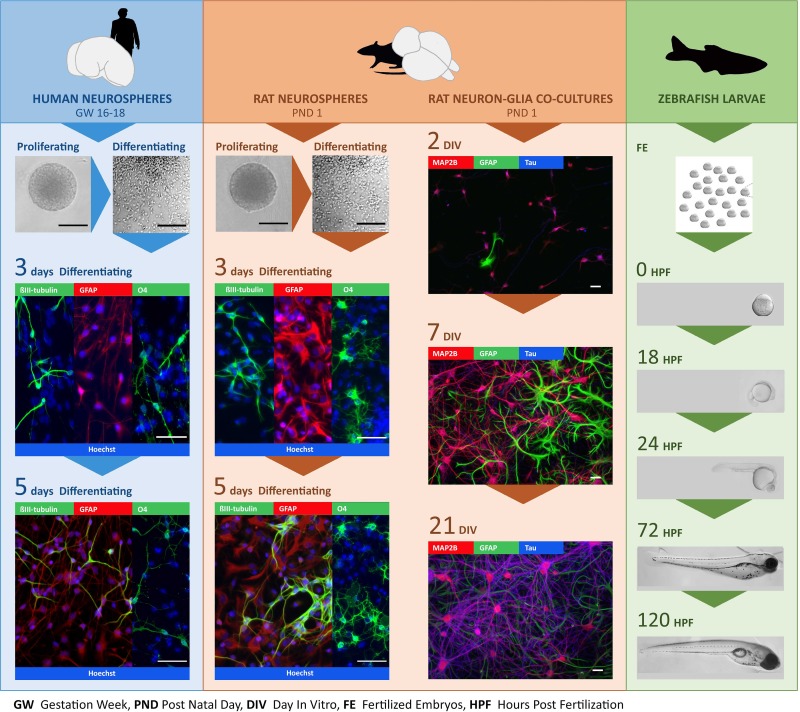
Fig 2 Overview of <italic>in vitro</italic> and <italic>in vivo</italic> models used for expression analyses of TH signaling-related genes.

Human and rat neurospheres, primary rat cortical cell cultures and zebrafish larvae were used to study the expression of TH signaling components and TH-responsive genes at multiple developmental stages. In human and rat neurospheres, gene expression was evaluated in proliferating neurospheres and at days 3 and 5 of differentiation; in rat neuron-glia co-cultures at day in vitro (DIV) 2, 7 and 21, and in zebrafish larvae at 0, 18, 24, 72 and 120 hours post fertilization (hpf). The fluorescent photomicrographs illustrate the differentiation of the human and rat neurospheres and primary rat cortical cell cultures at these specific developmental stages; the transmission images, the morphology of the neurosphere cultures and zebrafish at different stages of development. The markers used for immunocytochemical analyses include βIII-tubulin (neurons), glial fibrillary acidic protein (GFAP; astrocytes), O4 (oligodendrocytes), microtubule-associated protein 2 (MAP2B; soma and dendrites of neurons), tau (axons of neurons), and Hoechst (cell nuclei). Scale bars are 200 μm (proliferating neuropheres), 150 μm (transmission images of differentiating neurospheres) or 50 μm (fluorescent photomicrographs).

Acknowledgments
This image is the copyrighted work of the attributed author or publisher, and ZFIN has permission only to display this image to its users. Additional permissions should be obtained from the applicable author or publisher of the image. Full text @ PLoS One