IMAGE

Fig. 6

ID
ZDB-IMAGE-191230-681
Source
Figures for Wu et al., 2019
Image
Figure Caption

Fig. 6

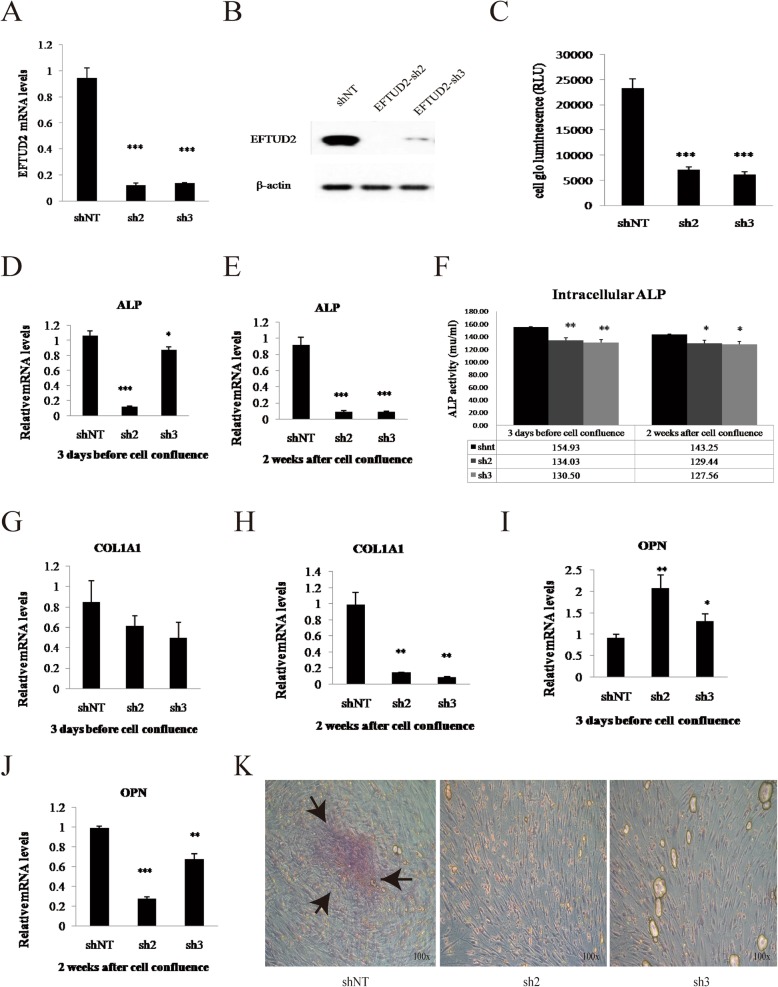
EFTUD2 gene knockdown in HCO cells. a Expression of EFTUD2 mRNA in HCO cells transfected with shNT, sh2, and sh3 lentiviruses. b Protein expression of EFTUD2 in HCO cells transfected with shNT, sh2, and sh3 lentiviruses. c Comparison of cell proliferation between HCO cells with EFTUD2 knockdown (sh2 and sh3) and the control group (shNT). d, e ALP mRNA levels in different groups (shNT, sh2, sh3) at 3 days before and 2 weeks after cell confluence in HCO cells. f Intracellular ALP activity (mu/ml) in HCO cells with EFTUD2 knockdown (sh2 and sh3) was much lower than in the control (shNT) at 3 days before cell confluence according to Student’s t test. g, h COL1A1 mRNA levels in HCO cells in different groups (shNT, sh2, sh3) at 3 days before and 2 weeks after cell confluence. i, j OPN mRNA levels in different groups (shNT, sh2, sh3) of HCO cells during development. k Alizarin red staining of HCO cells in these 3 groups at 3 days after cell confluence. Black arrows indicate calcific nodules (*P < 0.05; **P < 0.01; and ***P < 0.001; Student’s t test)

Acknowledgments
This image is the copyrighted work of the attributed author or publisher, and ZFIN has permission only to display this image to its users. Additional permissions should be obtained from the applicable author or publisher of the image. Full text @ Hum. Genomics