IMAGE

Fig. 3

ID
ZDB-IMAGE-191230-673
Genes
Source
Figures for Wu et al., 2019
Image
Figure Caption

Fig. 3

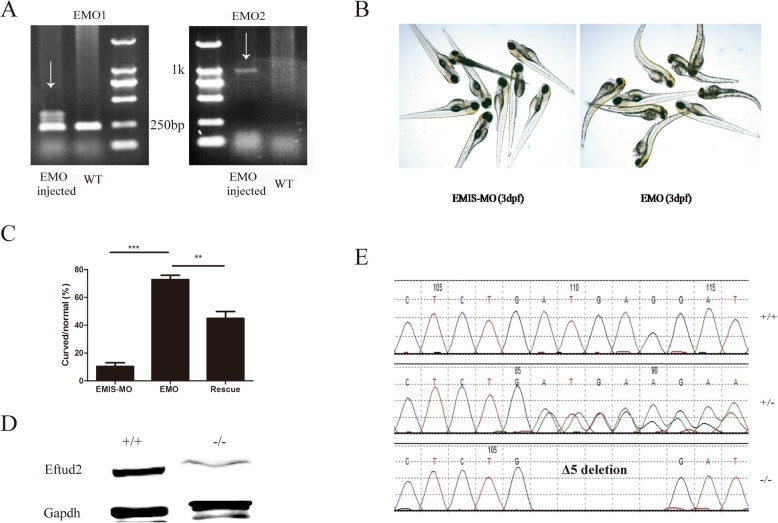
eftud2 gene knockdown and knockout in zebrafish. a PCR analysis and gel electrophoresis to identify the efficacy of an eftud2 morpholino (EMO). On the left, amplification was performed with the EMO1 primer, which resulted in a clear band in WT zebrafish and nonspecific bands in EMO-injected larvae. On the right, amplification was performed with the EMO2 primer, which produced a clear band in EMO-injected zebrafish and nothing in the WT. b Phenotypes of mutant zebrafish subjected to EMO injection and control morpholino (mismatch morpholino, EMIS-MO)-injected zebrafish at 3 dpf. c Comparison of the numbers of curved larvae among zebrafish injected with EMO, EMO together with normal EFTUD2 mRNA (rescue group), or EMIS-MO. d Western blot analysis of Eftud2 protein levels between the WT (+/+) and homozygous (−/−) mutant zebrafish at 3 dpf. e DNA sequencing of WT (+/+), heterozygous (+/−), and homozygous (−/−) mutants at 3 dpf

Figure Data
Acknowledgments
This image is the copyrighted work of the attributed author or publisher, and ZFIN has permission only to display this image to its users. Additional permissions should be obtained from the applicable author or publisher of the image. Full text @ Hum. Genomics