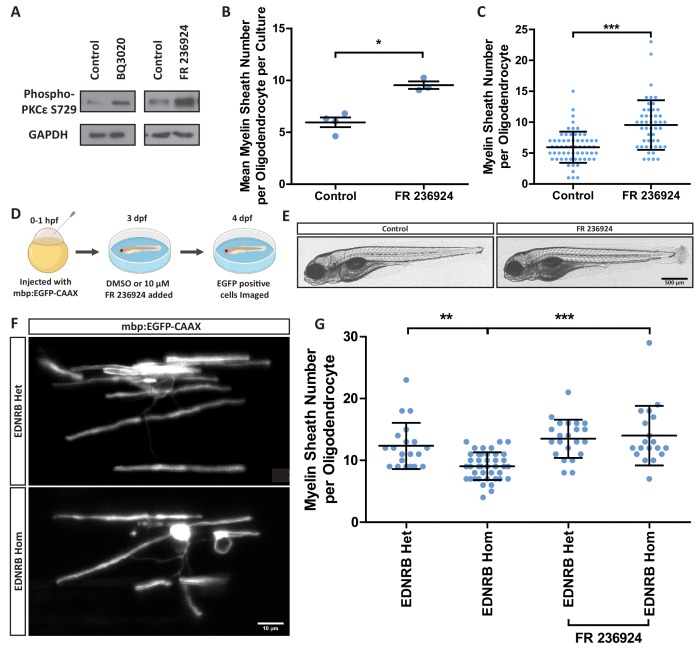
Figure 5 (A) Western blot images of rat oligodendrocytes treated with EDNRB agonist BQ3020 and PKCε agonist FR 236924 for 15 min. Antibodies used: Phosphorylated PKCε S729 and loading control GAPDH. (B) Mean number of myelin sheaths formed by rat oligodendrocytes on microfibers per experiment. Control 5.959 ± 0.4708 n = 4, FR 236924 9.542 ± 0.3614 n = 3 (mean ± standard error). Unpaired T-test p=0.0024. (C) Pooled data for number of myelin sheaths formed by rat oligodendrocytes on microfibers. Control 5.952 ± 2.525 n = 62 cells from four experiments, FR 236924 9.542 ± 4.016 n = 48 from three experiments (mean ± standard deviation). Mann-Whitney test, p=<0.001. (D) Schematic for zebrafish larvae treatment with FR 236924. (E) Representative images of 4 dpf zebrafish larvae treated with DMSO control or FR 236924. Scale bar = 500 μm. (F) Representative images of mbp:EGFP-CAAX oligodendrocytes in four dpf zebrafish larvae. Scale bar = 10 μm. (G) Pooled data for number of myelin sheaths formed by zebrafish oligodendrocytes. EDNRB Het 12.35 ± 3.746 n = 20 cells, EDNRB Hom (rse) 9.073 ± 2.229 n = 41 from four experiments, EDNRB Het + FR 236924 13.5 ± 3.098 n = 22 cells from five experiments, EDNRB Hom + FR 236924 14 ± 4.807 n = 19 cells (mean ± standard deviation). 1-way ANOVA
Image
Figure Caption
Figure Data
Acknowledgments
This image is the copyrighted work of the attributed author or publisher, and
ZFIN has permission only to display this image to its users.
Additional permissions should be obtained from the applicable author or publisher of the image.
Full text @ Elife

