IMAGE

Figure 4

ID
ZDB-IMAGE-191230-1353
Source
Figures for Hassan-Abdi et al., 2019
Image
Figure Caption

Figure 4

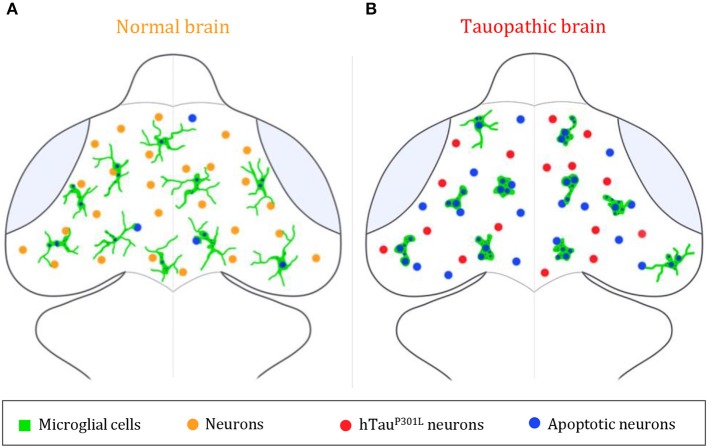
Summary illustration. (A,B) Brain illustrations of control embryo (A) and tauopathic embryo (B). In the control embryo brain, microglial cells (green) display a highly ramified morphology, allowing them to scan the brain and monitor neighboring neurons (orange) and eliminate apoptotic ones (blue). However, in presence of hTauP301L-expressing neurons (red), microglial cells (green) adopt an amoeboid morphology, that allows them to move faster throughout the brain in order to eliminate tauopathic neurons undergoing apoptosis (blue). In spite of an increased phagocytic rate of microglial cells in the tauopathic brain, there is a higher number of non-engulfed apoptotic neurons (blue), in comparison to the control brain; thus, suggesting a saturated phagocytic capacity of microglial in the tauopathic brain.

Acknowledgments
This image is the copyrighted work of the attributed author or publisher, and ZFIN has permission only to display this image to its users. Additional permissions should be obtained from the applicable author or publisher of the image. Full text @ Front. Neurosci.