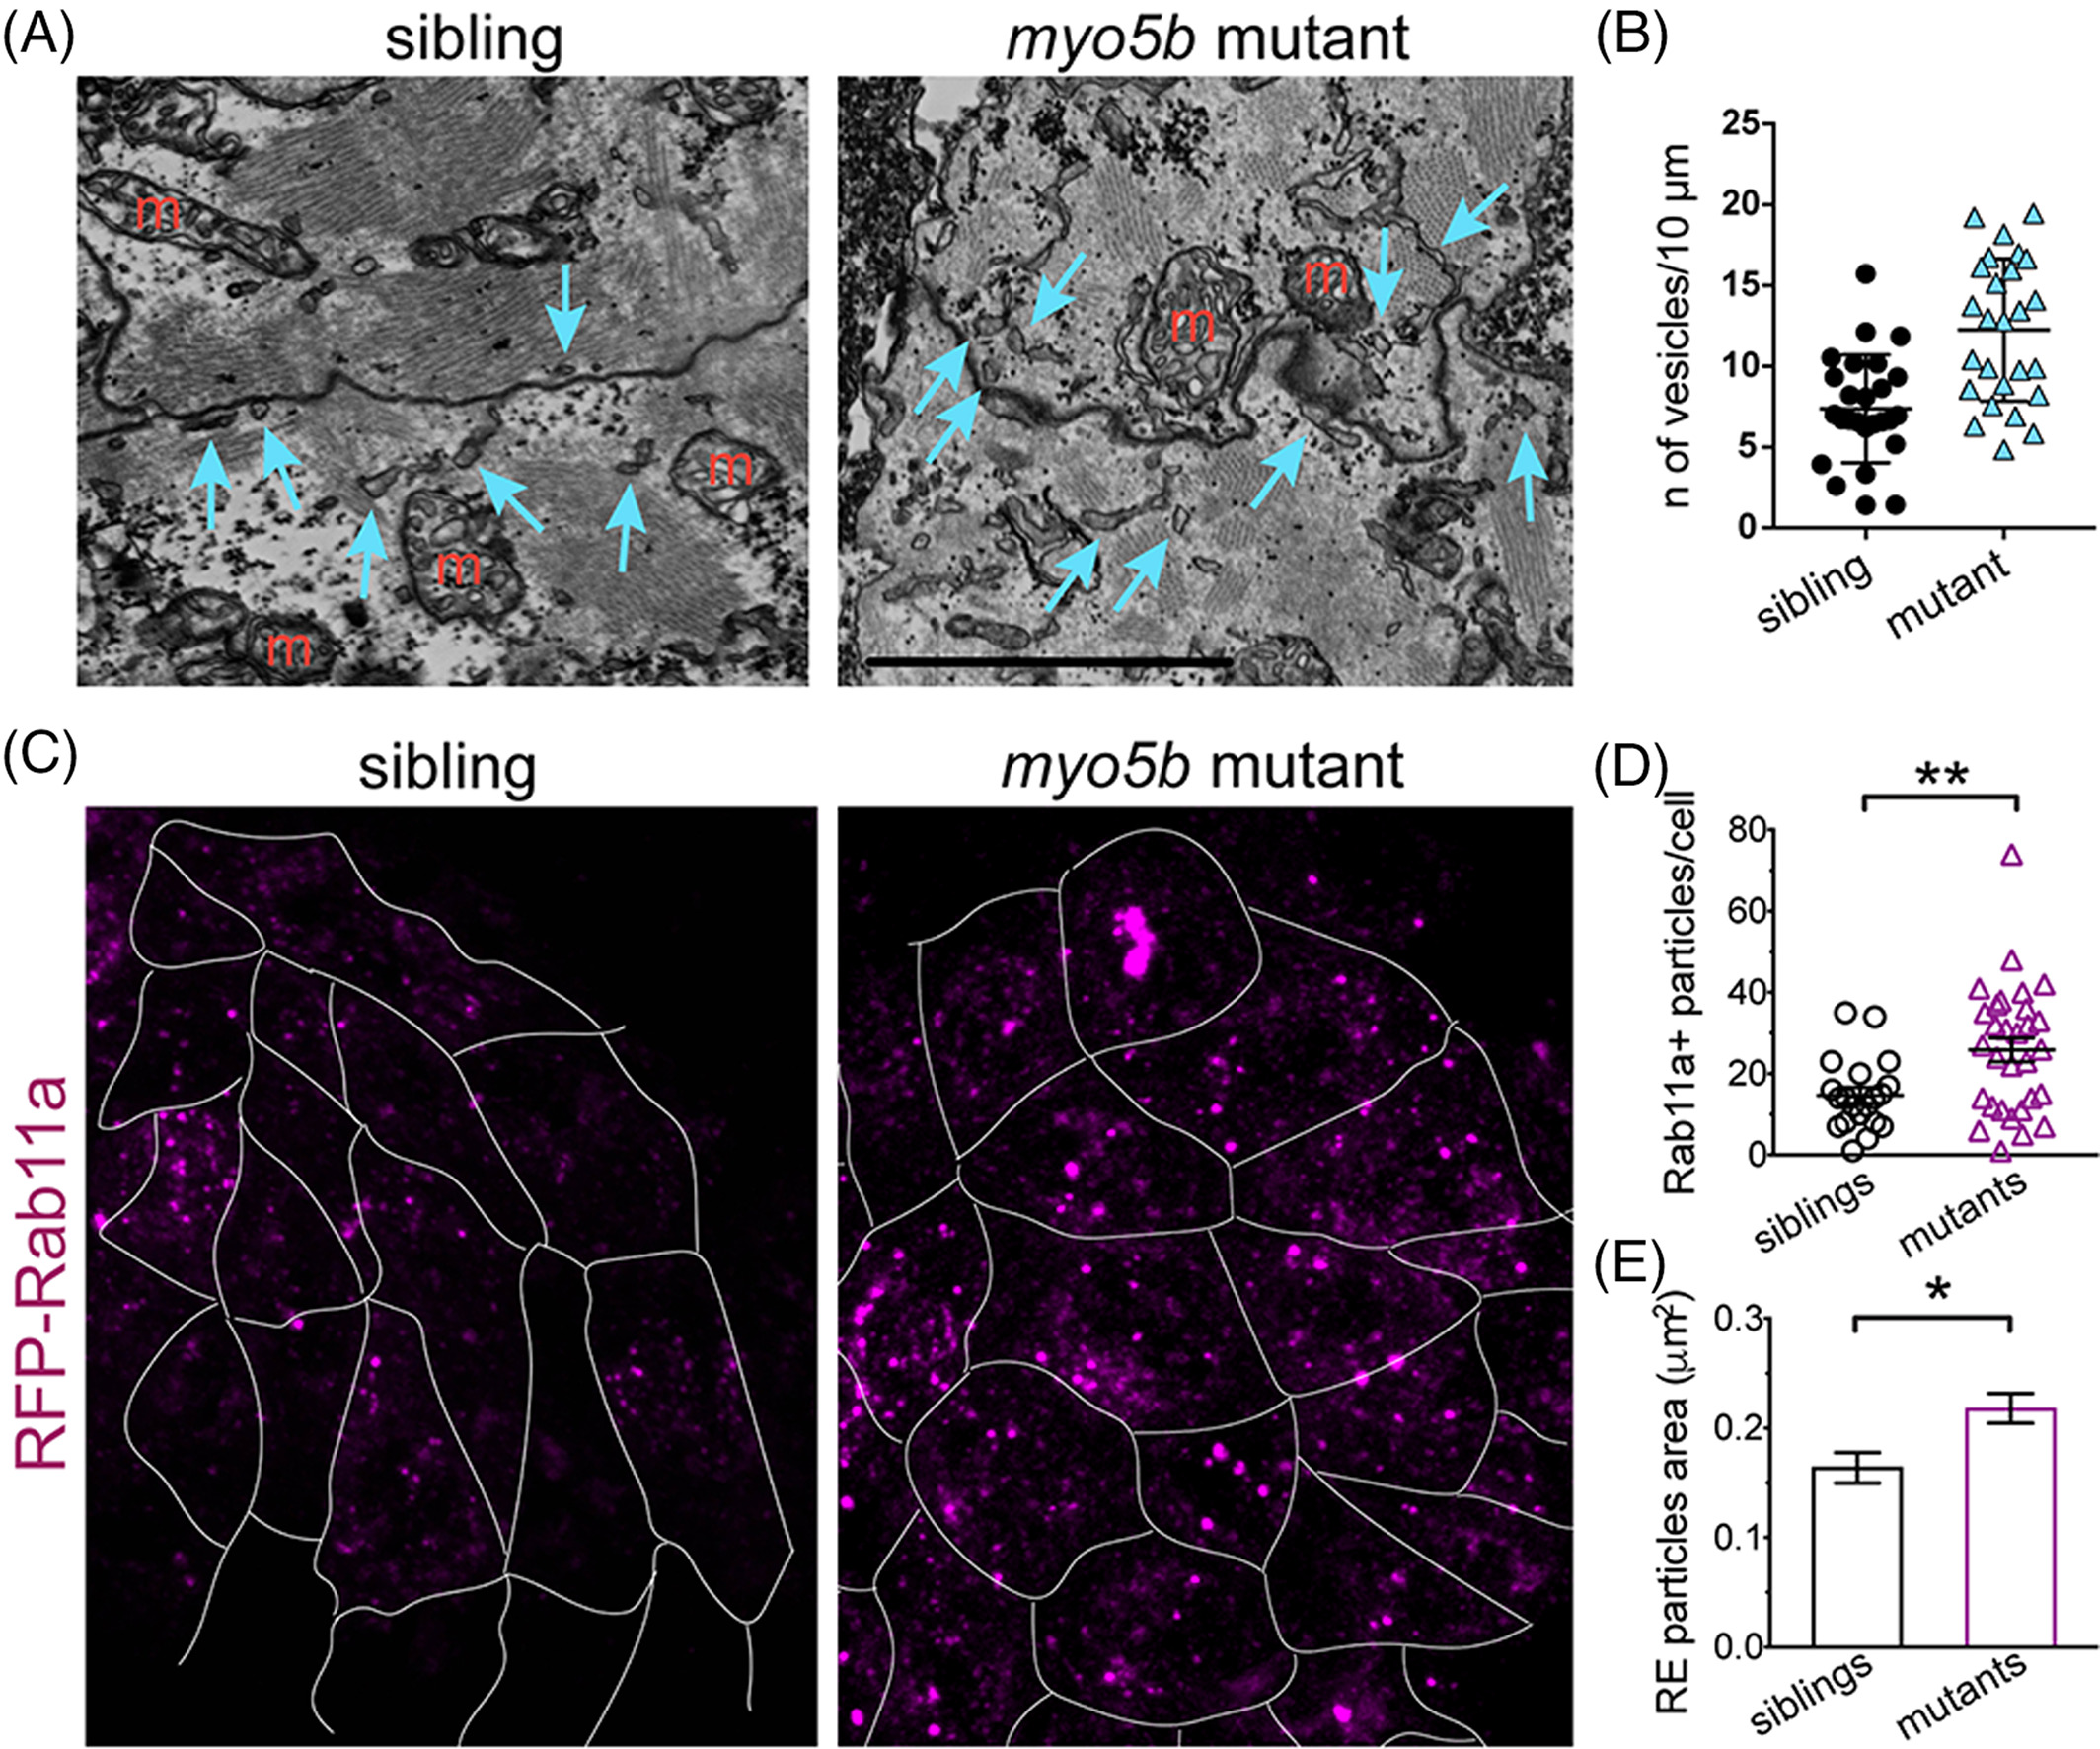
Fig. 3 myo5b mutant cardiomyocytes have increased recycling endosomes. A: Electron microscopic images of 36 hpf sibling and uq23ks mutant cardiomyocytes showing nonmitochondrial vesicles and tubular structures (blue arrows). M, mitochondria; Scale bar = 2.5 μm. B: Graph quantifying vesicles and tubular structures in siblings vs. mutant cardiomyocytes within 1 μm of the plasma membrane; mean ± SEM. C: Confocal imaging of recycling endosomes (labeled with RFP‐Rab11a) in sibling and mutant cardiomyocytes at 48 hpf. Cardiomyocyte membranes demarcated with white outline. D: Dot plot of the number of recycling endosomes per cell (as determined by RFP‐Rab11a‐postive particles), showing significantly more recycling endosomes in cardiomyocytes of uq23ks mutants vs. siblings. E: Histograms of recycling endosome size, showing significantly larger endosome size, consistent with endosome fusion.
Image
Figure Caption
Figure Data
Acknowledgments
This image is the copyrighted work of the attributed author or publisher, and
ZFIN has permission only to display this image to its users.
Additional permissions should be obtained from the applicable author or publisher of the image.
Full text @ Dev. Dyn.

