Fig. 4
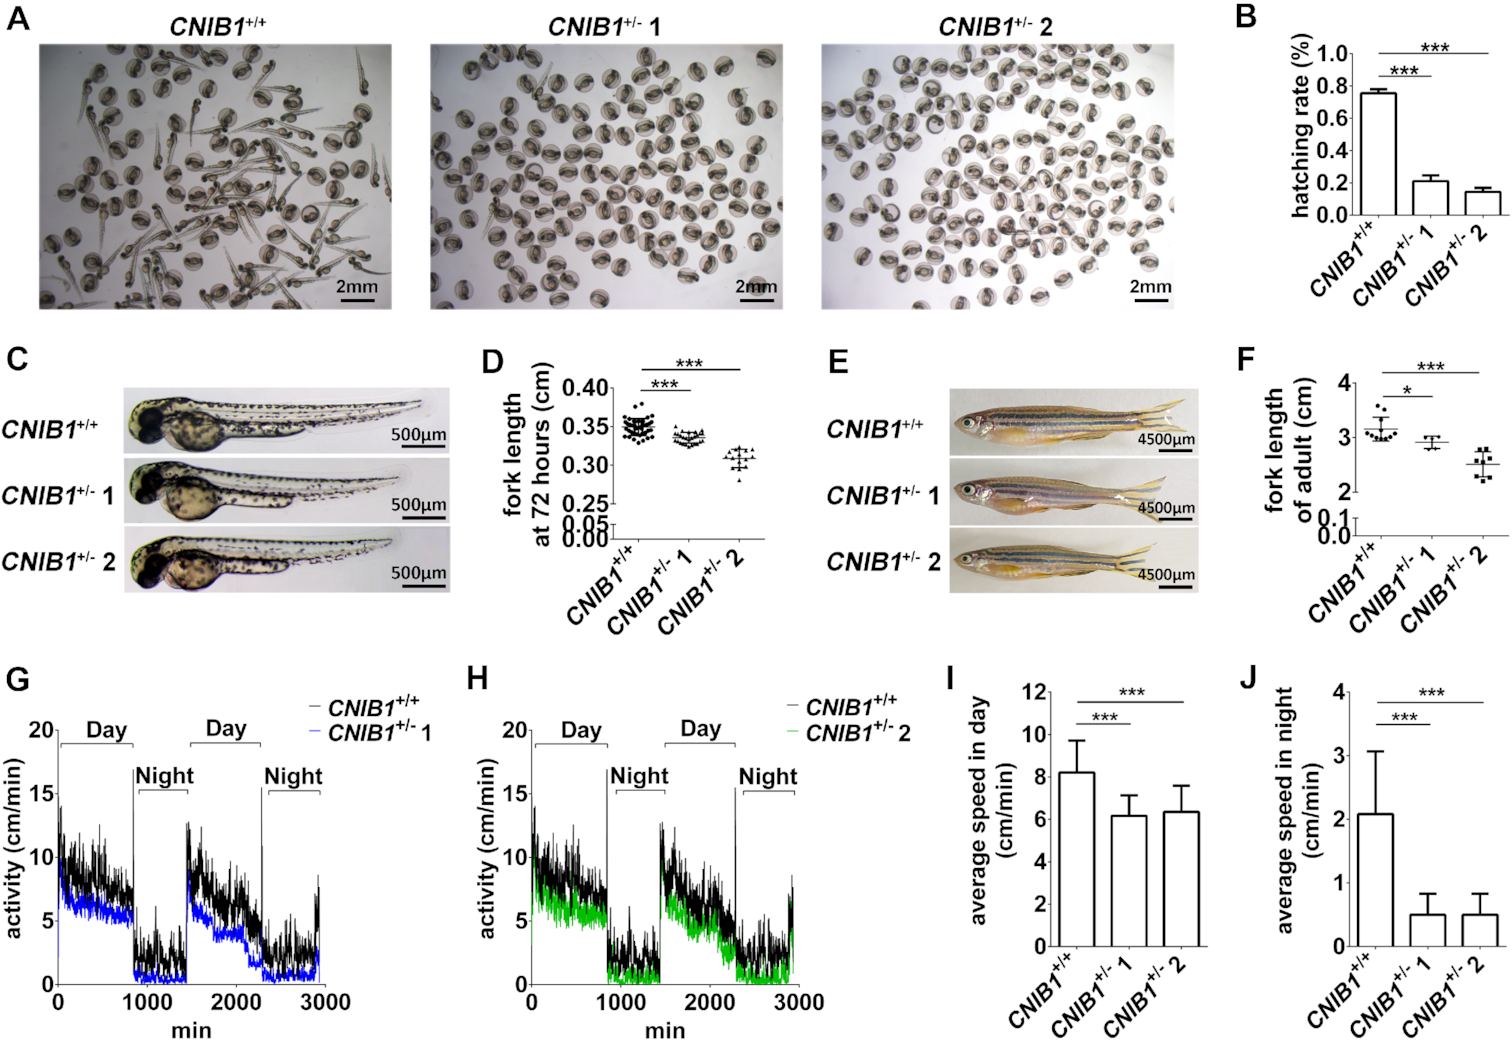
CNIB1+/− zebrafish exhibit developmental retardation and impaired locomotor activity. (A) Representative hatching status of the zebrafish offspring at 48 hpf from CNIB1+/+ (n = 130), CNIB1+/− 1 (n = 130) and CNIB1+/− 2 (n = 130) incross. Scale bars: 2 mm. (B) Schematic representation of A. (C, D) Representative images and the schematic representation of the fork lengths of the zebrafish offspring at 5 dpf from CNIB1+/+ (n = 42), CNIB1+/− 1 (n = 27) and CNIB1+/− 2 (n = 15) incross. Scale bars: 500 μm. (E, F) Representative images and the schematic representation of the fork lengths of the CNIB1+/+ (n = 11), CNIB1+/− 1 (n = 8) and CNIB1+/− 2 (n = 5) adult zebrafish at 4 months. Scale bars: 4500 μm. (G, H) Activity records of the zebrafish offspring at 5 dpf from CNIB1+/+ (n = 16), CNIB1+/− 1 (n = 16) and CNIB1+/− 2 (n = 16) incross at day (G) or night (H). (I, J) The schematic representation of the average locomotion speed gathered from figures G and H, respectively.

