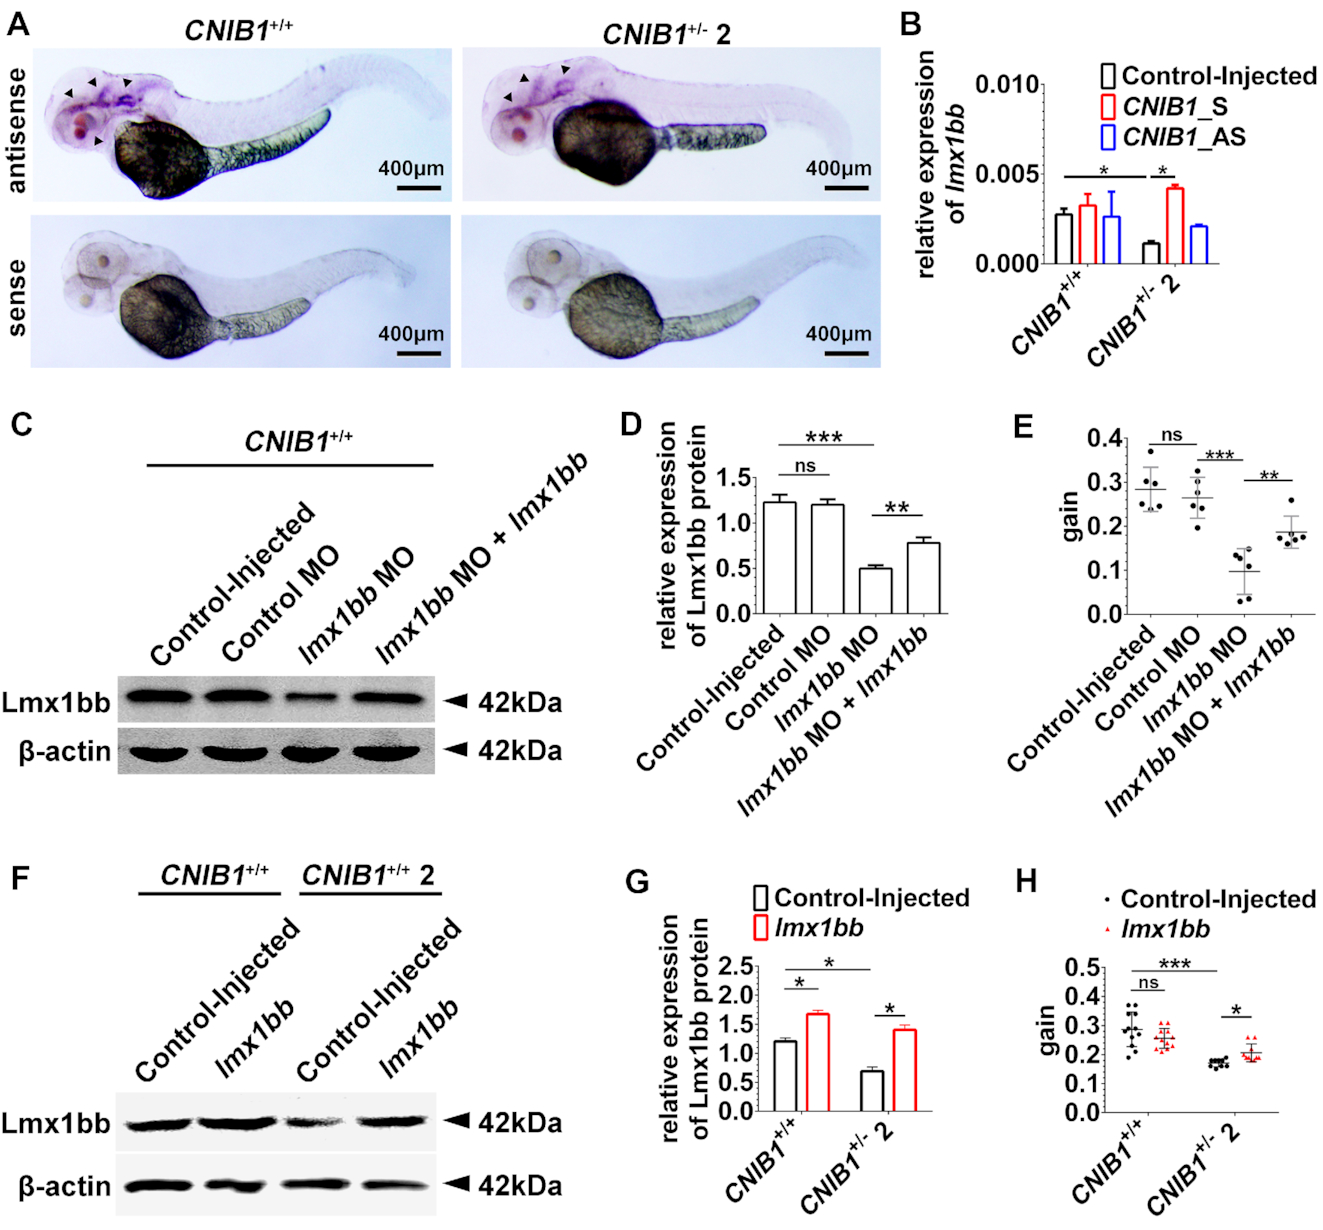
Fig. 6
CNIB1 mediates visual function via lmx1bb in zebrafish. (A) In situ hybridization of lmx1bb (indicated by arrowheads) in zebrafish offspring of CNIB1+/+ and CNIB1+/− 2 incross at 48 hpf. Scale bars: 400 μm. (B) Relative expression level of lmx1bb mRNA detected by RT-qPCR in the indicated zebrafish offspring (CNIB1+/+ or CNIB1+/− 2) that were either Control-injected or injected with in vitro transcribed CNIB1 sense (CNIB1_S) or antisense RNAs (CNIB1_AS). The data were normalized to β-actin. (C) Representative images of Western blot for Lmx1bb and β-actin in CNIB1+/+ zebrafish with the indicated modifications. Control MO, mismatch lmx1bb MO; lmx1bb MO, lmx1bb morphants; lmx1bb MO+lmx1bb, co-injection of lmx1bbmorphants and in vitro transcribed lmx1bb mRNA. (D) Quantified expression level of Lmx1bb protein (normalized to β-actin) in the zebrafish shown in C, n is 30 in each group. (E) Gain value of the OKR assay in the zebrafish shown in C. Control-injected, n = 6; Control MO, n = 6; lmx1bb MO, n = 6; lmx1bb MO + lmx1bb, n = 6. (F) Representative images of Western blot for Lmx1bb and β-actin in zebrafish offspring from either CNIB1+/+ or CNIB1+/− 2 incross with the indicated modifications. lmx1bb, injection with in vitro transcribed lmx1bbmRNA. (G) Quantified expression levels of Lmx1bb protein (normalized to β-actin) in the zebrafish shown in F, n = 20. (H) Gain value of the OKR assay in the zebrafish shown in F. Control-injected CNIB1+/+, n = 12; lmx1bb CNIB1+/+, n = 12; Control-injected CNIB1+/− 2, n = 9; lmx1bb CNIB1+/− 2, n = 10.

