Fig. 1
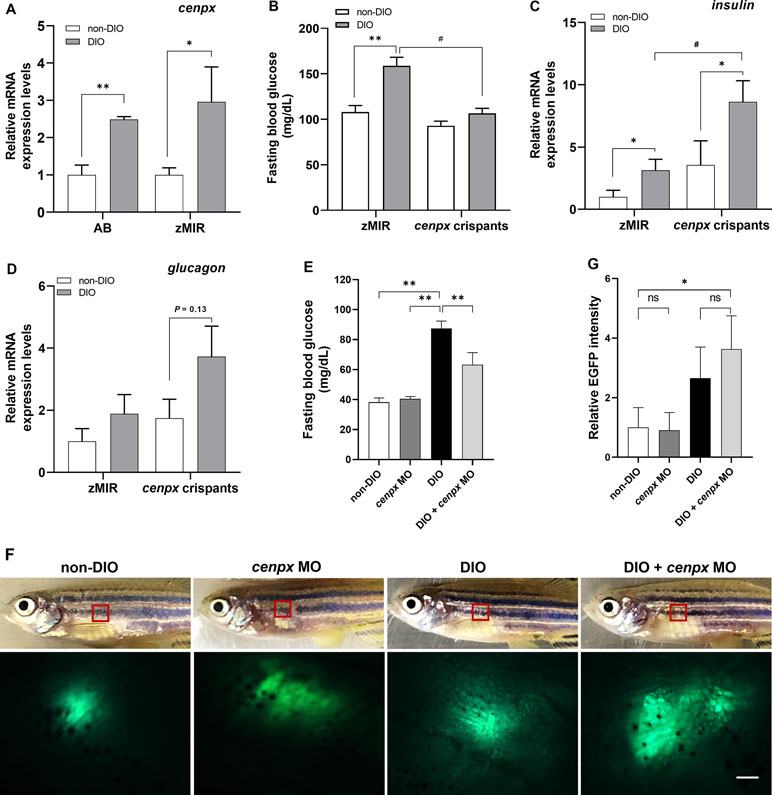
Deletion of cenpx gene suppressed hyperglycemia in diabetic zebrafish. (A)The relative mRNA level of cenpx in the hepatopancreas tissue of AB and zMIR zebrafish. Data are shown as relative levels of cenpx mRNA of AB and zMIR strains to that in their corresponding non-DIO controls. n = 5. *P < 0.05, **P < 0.01 versus the non-DIO group. (B) The fasting blood glucose levels in zMIR zebrafish and cenpxcrispants after overfeeding treatment. n = 5. **P < 0.01 versus the non-DIO group; #P< 0.05 versus the DIO group. (C, D) The mRNA levels of insulin and glucagon in cenpx crispants. RNA was isolated from the hepatopancreas of zebrafishes from overfeeding and normal feeding groups. The mRNA levels of insulin and glucagonwere compared with that of amylase as a marker for the endocrine pancreas. Data are shown as the relative expression level of insulin and glucagon mRNA to that in non-DIO zMIR. n = 5. *P < 0.05 versus the non-DIO group; #P < 0.05 versus the DIO zMIR group. (E) Fasting blood glucose levels in MO-treated ins-EGFP zebrafish after 4 weeks of normal feeding or overfeeding. Fishes were treated with cenpx MO twice a week. n = 5. **P < 0.01 versus the DIO group; (F) Upper panel are the bright field of ins-EGFP zebrafishes with or without i.p. injection of cenpx MO in DIO. Lower panel are EGFP levels in the exocrine pancreas areas that were monitored by fluorescence stereoscopic microscopy. The red box marks the region displayed in the fluorescence image. Scale bar = 0.5 mm. (G) Graph of relative EGFP intensities from lower panel of F. n = 5. *P < 0.05 versusthe non-DIO group.

