
|
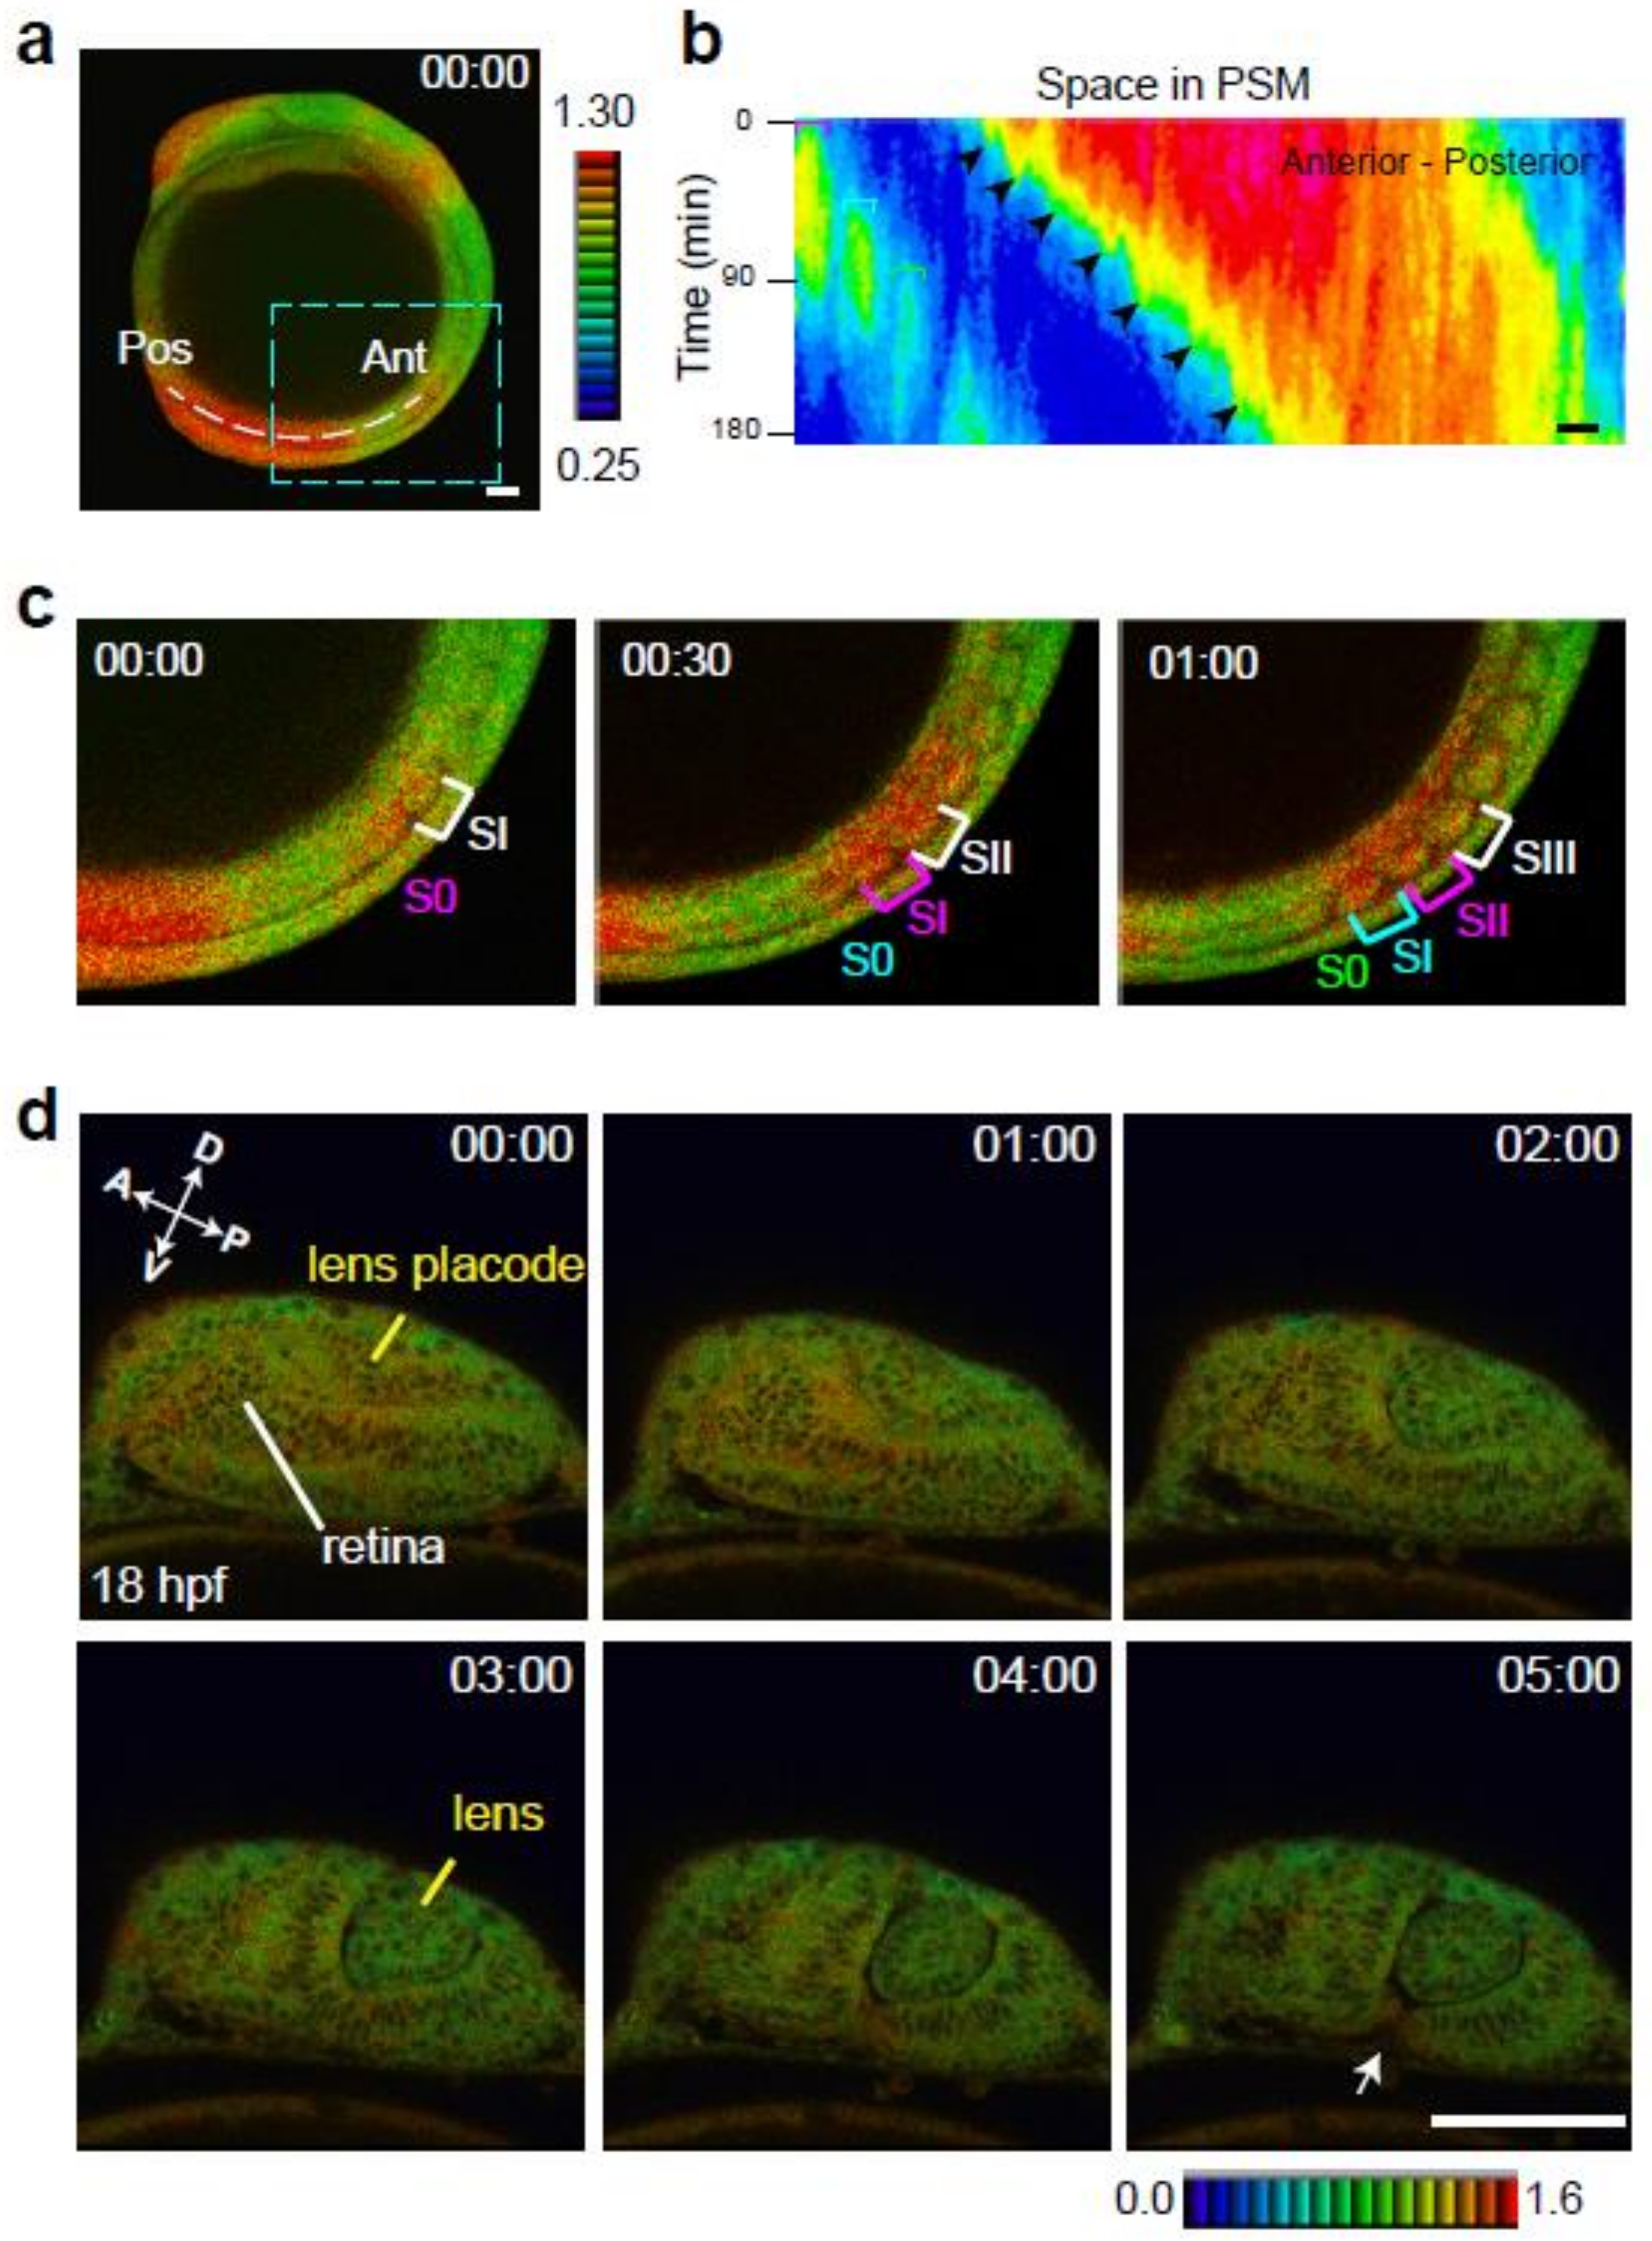
Fig. 5
ERK activity dynamics in specific tissues/organs. (a) A white dotted line represents the region of interest for kymograph analysis. (b) Kymograph of the spatial and temporal dynamics of ERK activity in the presomitic mesoderm at the tail bud. Horizontal and vertical axes indicate the length from the anterior end of the presomitic mesoderm (m) and time progression (min), respectively. Scale bar, 50 m. (c) Higher magnification of the rectangle (light blue dotted line) in panel a. Newly developed somites are indicated by S0. Brackets indicate somite formation. The appearance of S0 (pink) indicates ERK activation within the S0. ERK activation level is high when S0 becomes SI (pink bracket), and the level decreases when SI becomes SII (pink bracket). Scale bar, 100 m. (d) At 18 hpf, ERK activation is observed in the retina and lens placode. During lens formation (18–20 hpf), ERK activation decreases gradually in the lens placode and remains stable in the retina. ERK activity decreases in the anterior side of the retina and is then restricted to the fissure of the retina on the ventral side.