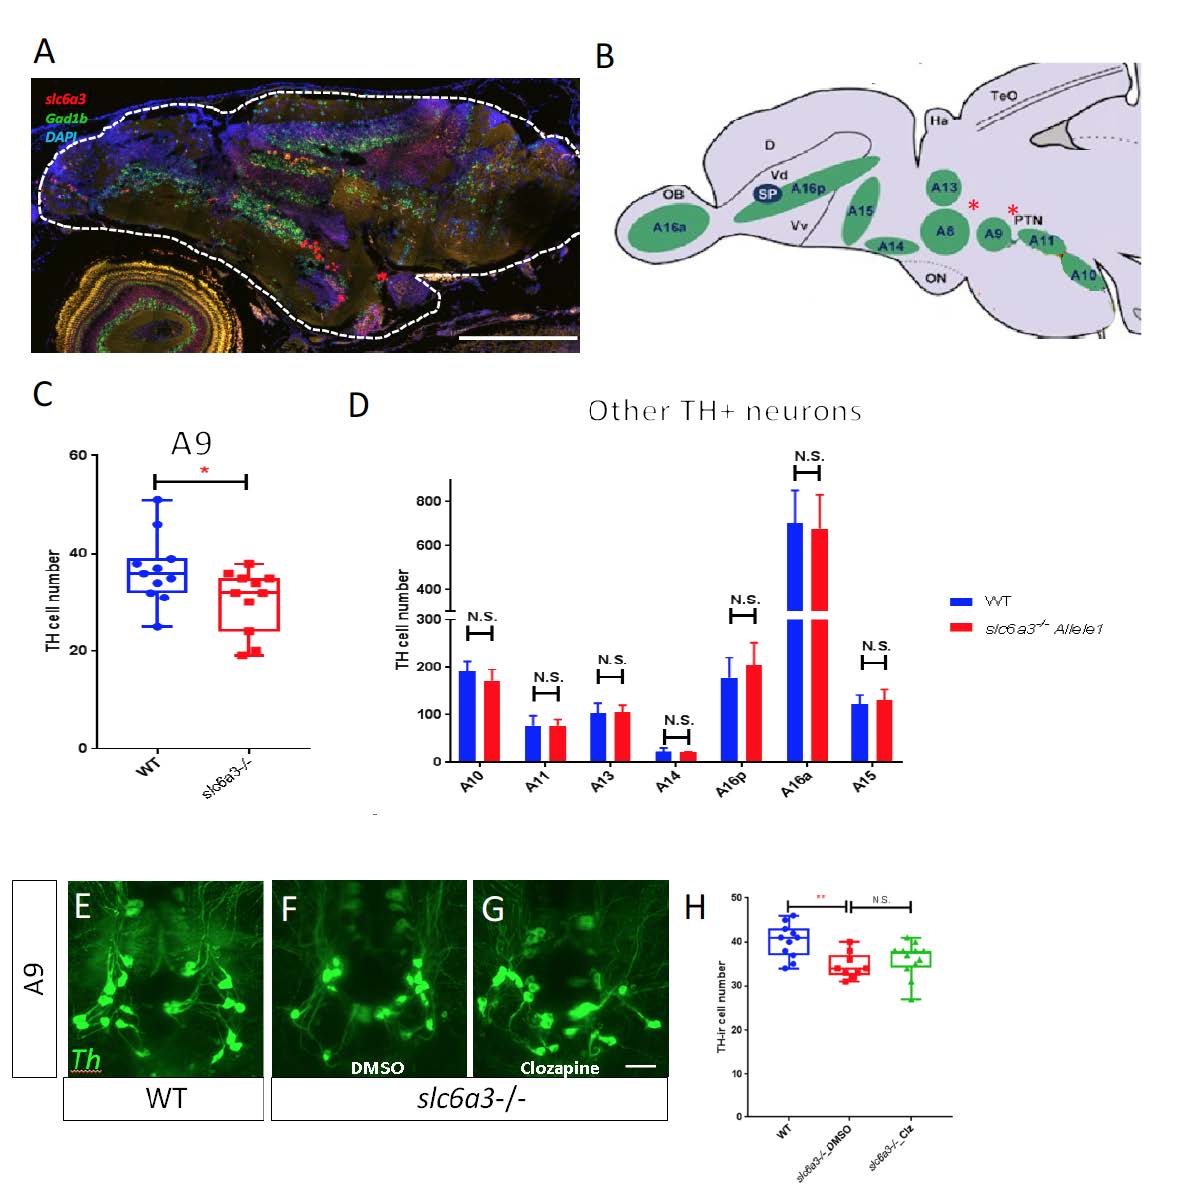
Fig. S5
Whole brain CUBIC clearing to visualize TH+ neurons in the adult brain, related to Figure 2 and Figure 3. (A) RNAscope confirms expression of slc6a3 expression in the zebrafish brain. gad1b is a marker of brain glutamatergic neurons and used as a reference of brain areas. Scale bar=250μm (B) Diagram of location of TH+ neuron groups (dark green) in the zebrafish brain, in a sagittal view. D, dorsal telencephalic area; Ha, habenula; OB, olfactory bulb; ON, optic nerve; PTN, posterior tuberculum; Vd, dorsal telencephalic area; Vv, ventral telencephalic area; TeO, optic tectum; SP, Subpalium. (Parker et al., 2013) (C) slc6a3-/- allele1 fish manifest slight reduction of A9 DA neuron numbers at 2mpf. Box plot of cell numbers of A9 neurons are shown. Error bar=standard deviation. n=11 for both WT and slc6a3-/- allele1. *p<0.05. Significance test: Wilcoxon–81 Mann–Whitney test. (D) TH+ neuronal number is unaffected in other regions of the slc6a3-/- allele1 brain. Error bar=standard deviation. N>=8 for both WT and slc6a3-/- allele1 conditions. N.S.=no significance. Significance test: Wilcoxon–Mann–Whitney test. (E-H) 2.5uM clozapine treatment does not significantly rescue the A9 cell number in slc6a3-/- allele1. (E-G) Representative images of A9 neurons by z-projection of A9 neuron images. Scale bar=10μm. (H) Box plot of A9 DA cell number in wild-type, DMSO and 2.5uM clozapine treated slc6a3-/- allele1 at 3mpf. For all n>=12. Error bar=standard deviation. **p<0.01. N.S.=no significance. Significance test: one way ANOVA Kruskal-Wallis test.

