
|
Fig. 2
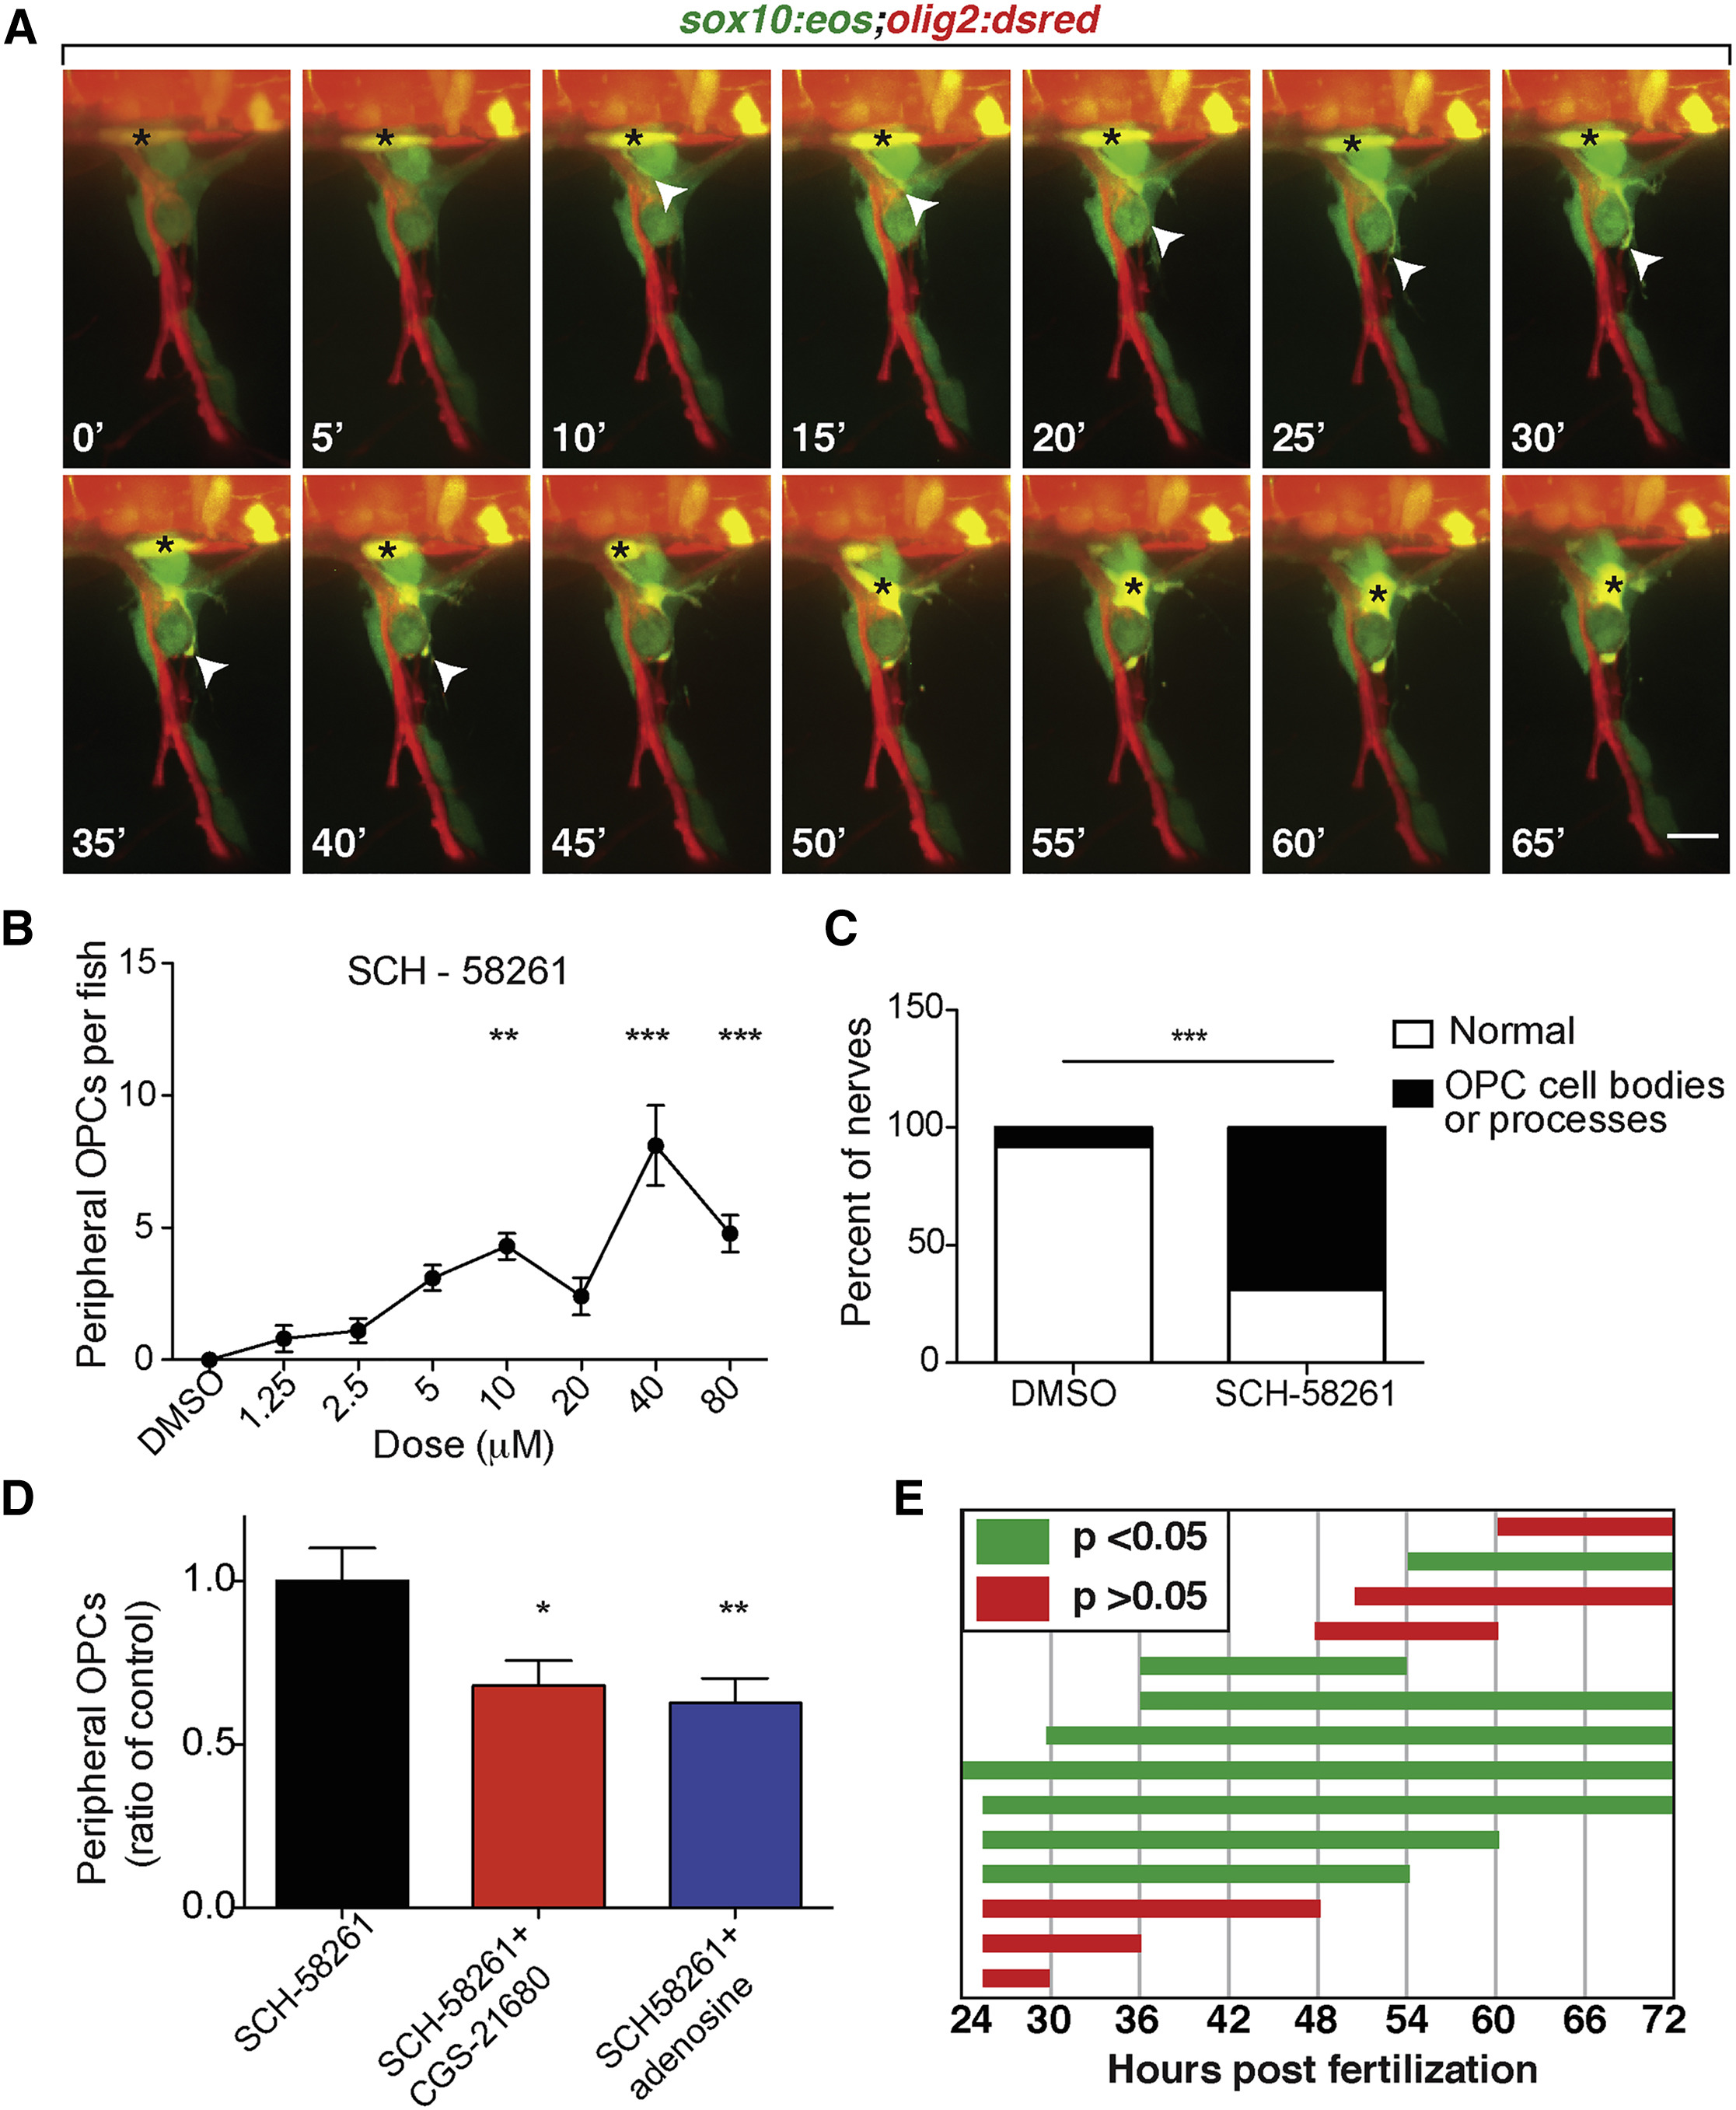
A2a AR Antagonist Causes OPC Migration through the MEP TZ
(A) Frames captured from a 15 h time-lapse movie of a sox10:eos;olig2:dsred larva treated with CGS-15943 from 24 hpf to 3 dpf and imaged from 57 to 72 hpf; 0′ is 58 hpf. The black asterisk marks OPC body. Arrowheads mark OPC leading process.
(B) Dose-response curve of the number of peripheral OPCs for fish treated from 24 hpf to 3 dpf with SCH-58261. Mean ± SEM, n = 10 larvae per dose; ∗∗p < 0.01 and ∗∗∗p < 0.0001.
(C) Percentage of nerves at 3 dpf that have ectopic OPC processes and/or cell bodies. n = 60 DMSO, n = 98 SCH-58261; p < 0.01.
(D) Mean ± SEM of peripheral OPCs in olig2:dsred larvae treated with 10 μM SCH-58261 alone or in combination with 2.5 μM CGS-21680 or 5 μM adenosine from 36 hpf to 3 dpf. n = 30 fish per treatment; ∗p < 0.05 and ∗∗p < 0.01.
(E) Peripheral OPC counts for larvae treated with 10 μM SCH-58261 during distinct time periods. Green bars indicate mean peripheral OPC counts significantly above DMSO control (p < 0.05). Red bars indicate mean peripheral OPC counts not significantly different than DMSO (p > 0.05). n = 9–12 larvae per condition. Scale bar, 20 μM.