
|
Fig. 3
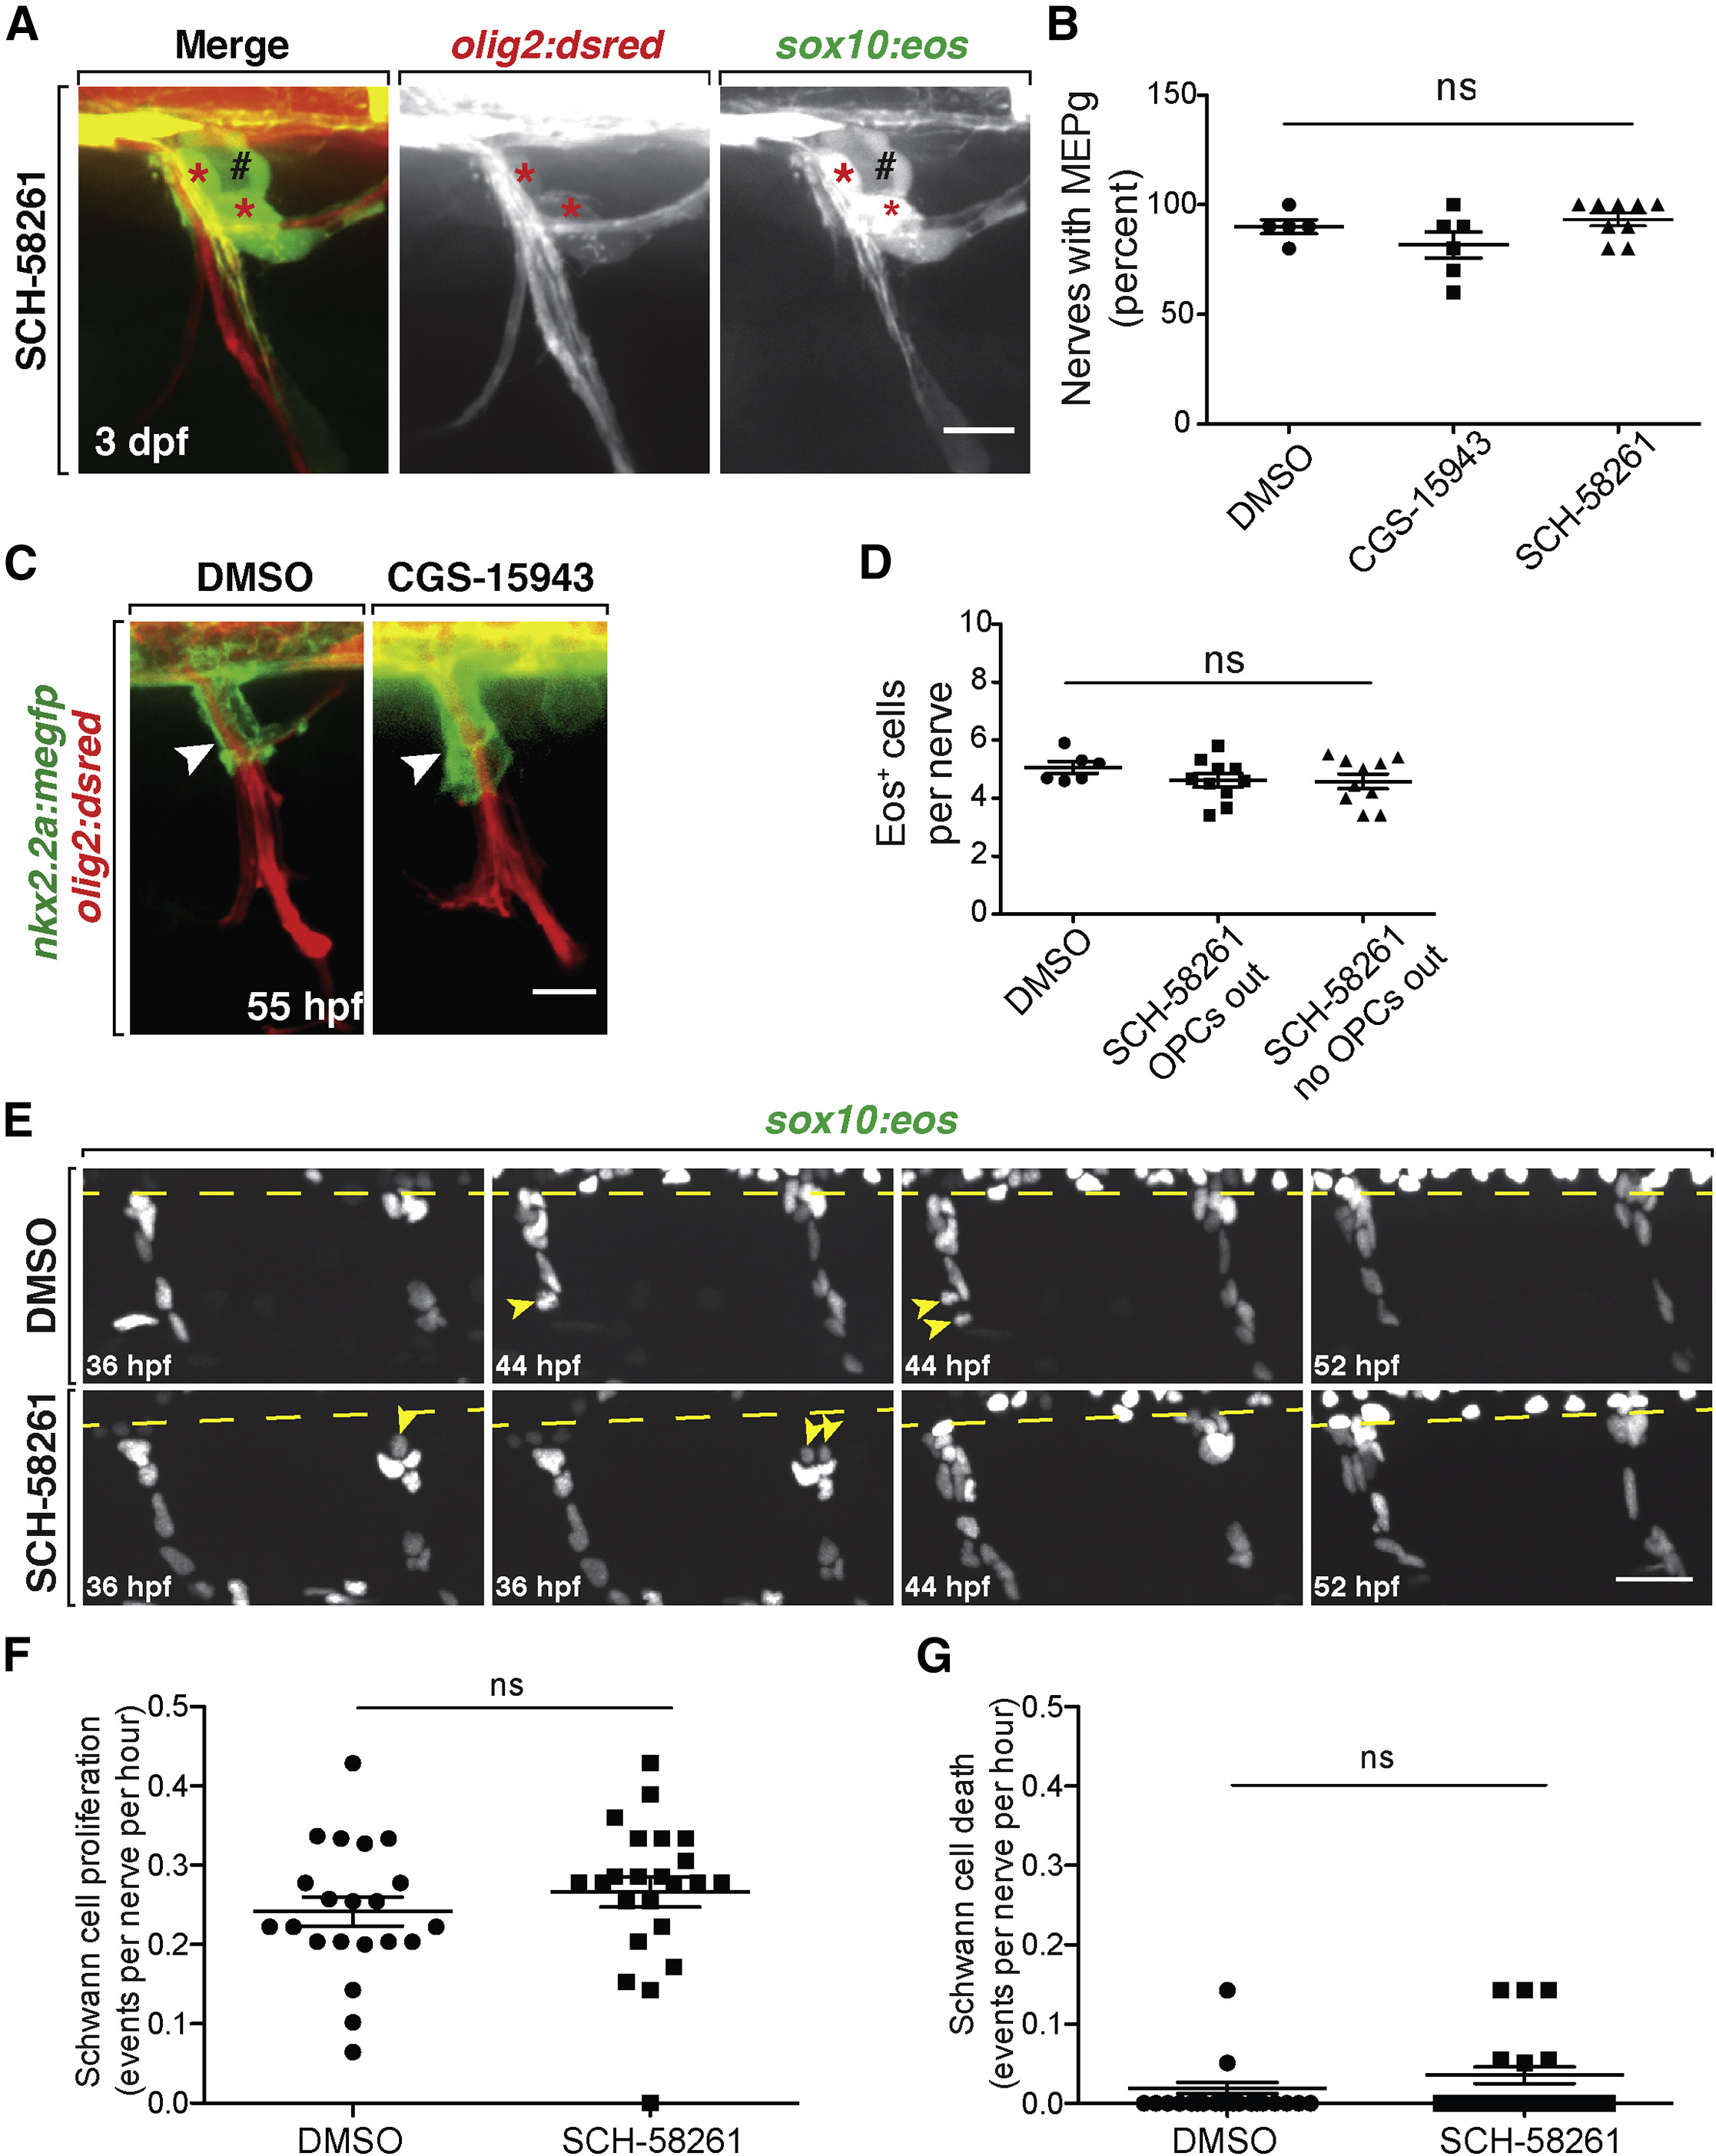
A2a AR Antagonism Does Not Affect Spinal Motor NerveDevelopment
(A) Motor nerve in a 3 dpf olig2:dsred;sox10:eos larvae treated with SCH-58261 from 36 hpf to 3 dpf. Red asterisks mark sox10+/olig2+ MEP glia at the MEP TZ. Black pound signs denote sox10+/olig2− dorsal root ganglia.
(B) Mean ± SEM of the percentage of nerves per larva at 3 dpf with sox10+/olig2+ MEP glia after treatment from 36 hpf to 3 dpf with DMSO (n = 5), CGS-15943 (n = 6), or SCH-58261 (n = 9). Ten nerves were quantified per larva. p = 0.14.
(C) Fifty-five hours post-fertilization nkx2.2a:megfp;olig2:dsred larvae treated with DMSO or CGS-15943 from 36 to 55 hpf showing PG extension (arrowheads) on the nerve.
(D) Quantification of Eos+ cells per nerve at 3 dpf in DMSO and SCH-58261-treated larvae. Mean ± SEM for DMSO (n = 6 fish) and SCH-58261 (n = 10 fish). Ten nerves per fish. p = 0.39.
(E) Frames captured from a 20 h time-lapse video starting at 36 hpf in sox10:nls-eos embryos treated with DMSO or SCH-58261. The spinal cord is denoted by a dashed line. SCs divide (yellow arrowheads) along the nerves in both treatments.
(F) Quantification of SC proliferation during these time lapses. Mean ± SEM for DMSO (n = 6 fish, 21 nerves) and SCH-58261 (n = 6 fish, 23 nerves). p = 0.35.
(G) Quantification of SC death during these time-lapse movies. Mean ± SEM for DMSO (n = 6 fish, 21 nerves) and SCH-58261 (n = 6 fish, 23 nerves). p = 0.20. Scale bars, 20 μM.