
|
Fig. 3-S1
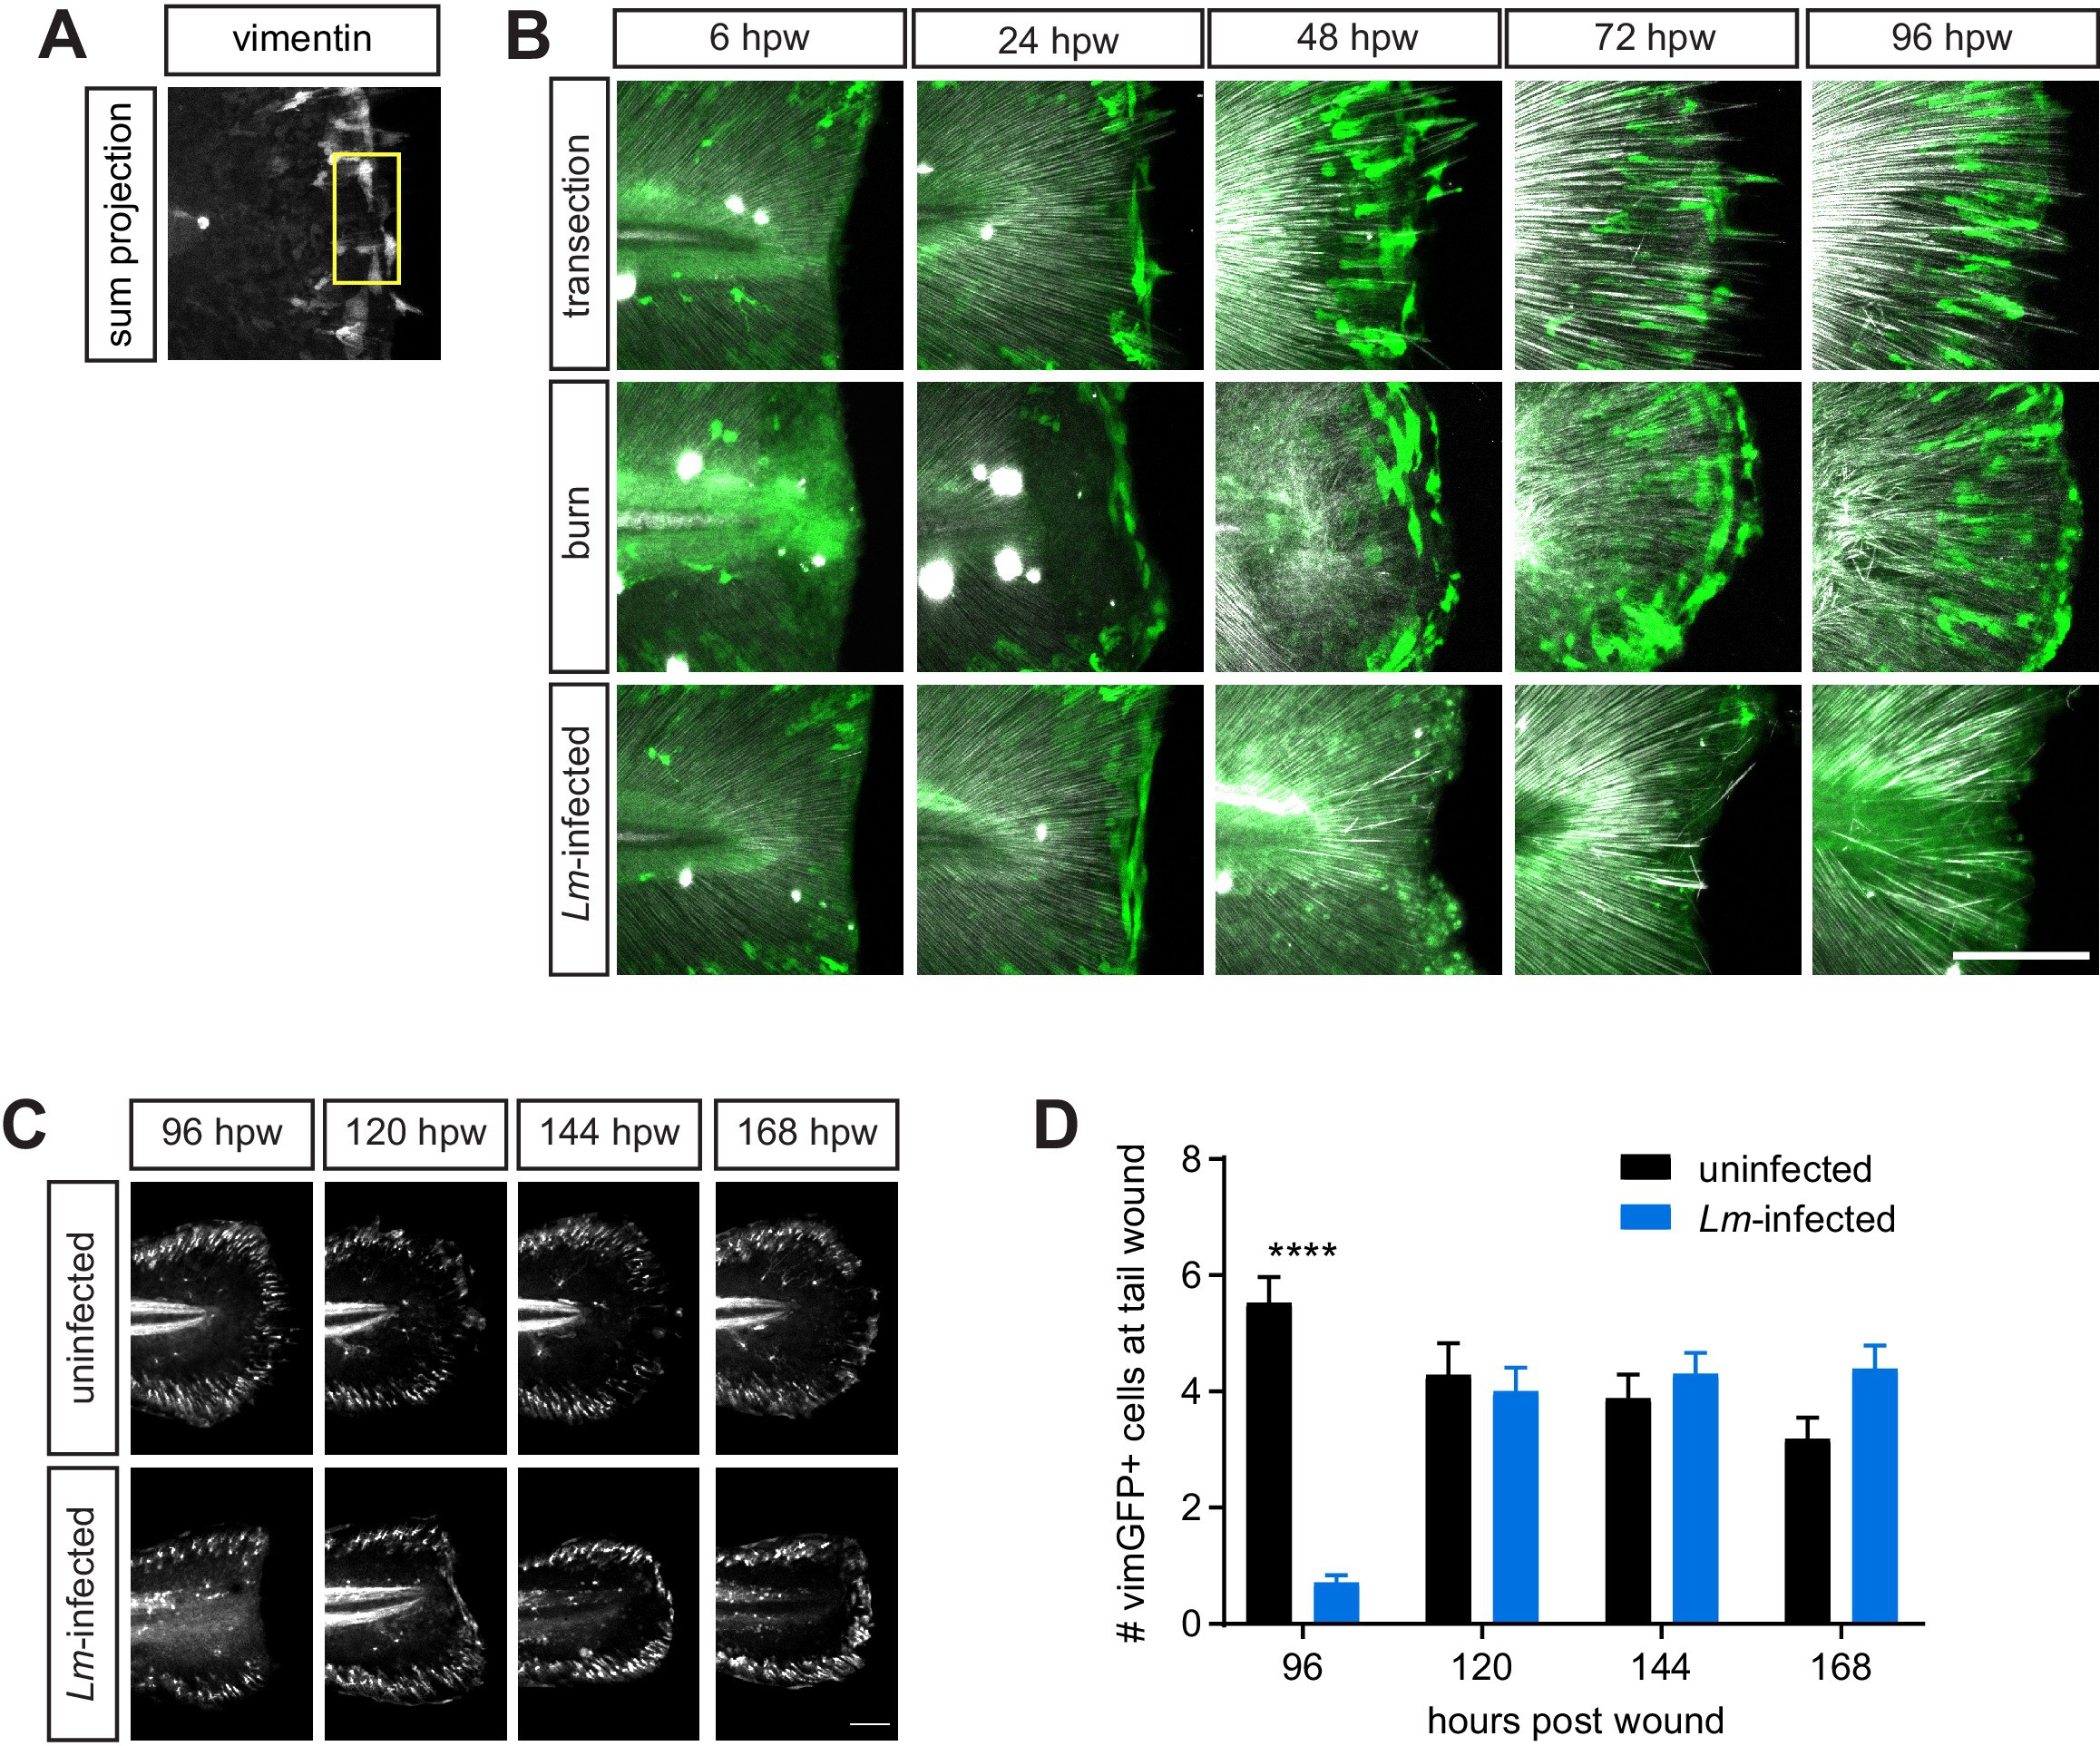
VimGFP-positive cells at the wound recover over time at the Lm-infected tail wound.
(A) an example of an image with vimentin expression showing a 50 × 100 micron box placed strategically to count vimGFP-positive cells is shown (see Materials and methods). (B) Merge of z-projections of vimGFP-positive cell images (green) with z-projections of corresponding SHG images (white) from Figure 3F. (C) sum projections of z series acquired by spinning disk confocal microscope using Tg(vim:GFP)larvae following uninfected or Lm-infected transection. Scale bar is 100 micron. (D) Graph showing quantitation of vimGFP-positive cells at the wound over time. Values are least square means and SE from three biological replicates, with associated p values. Total N = 27–48 larvae per time point for each treatment. ***<0.0001.