
|
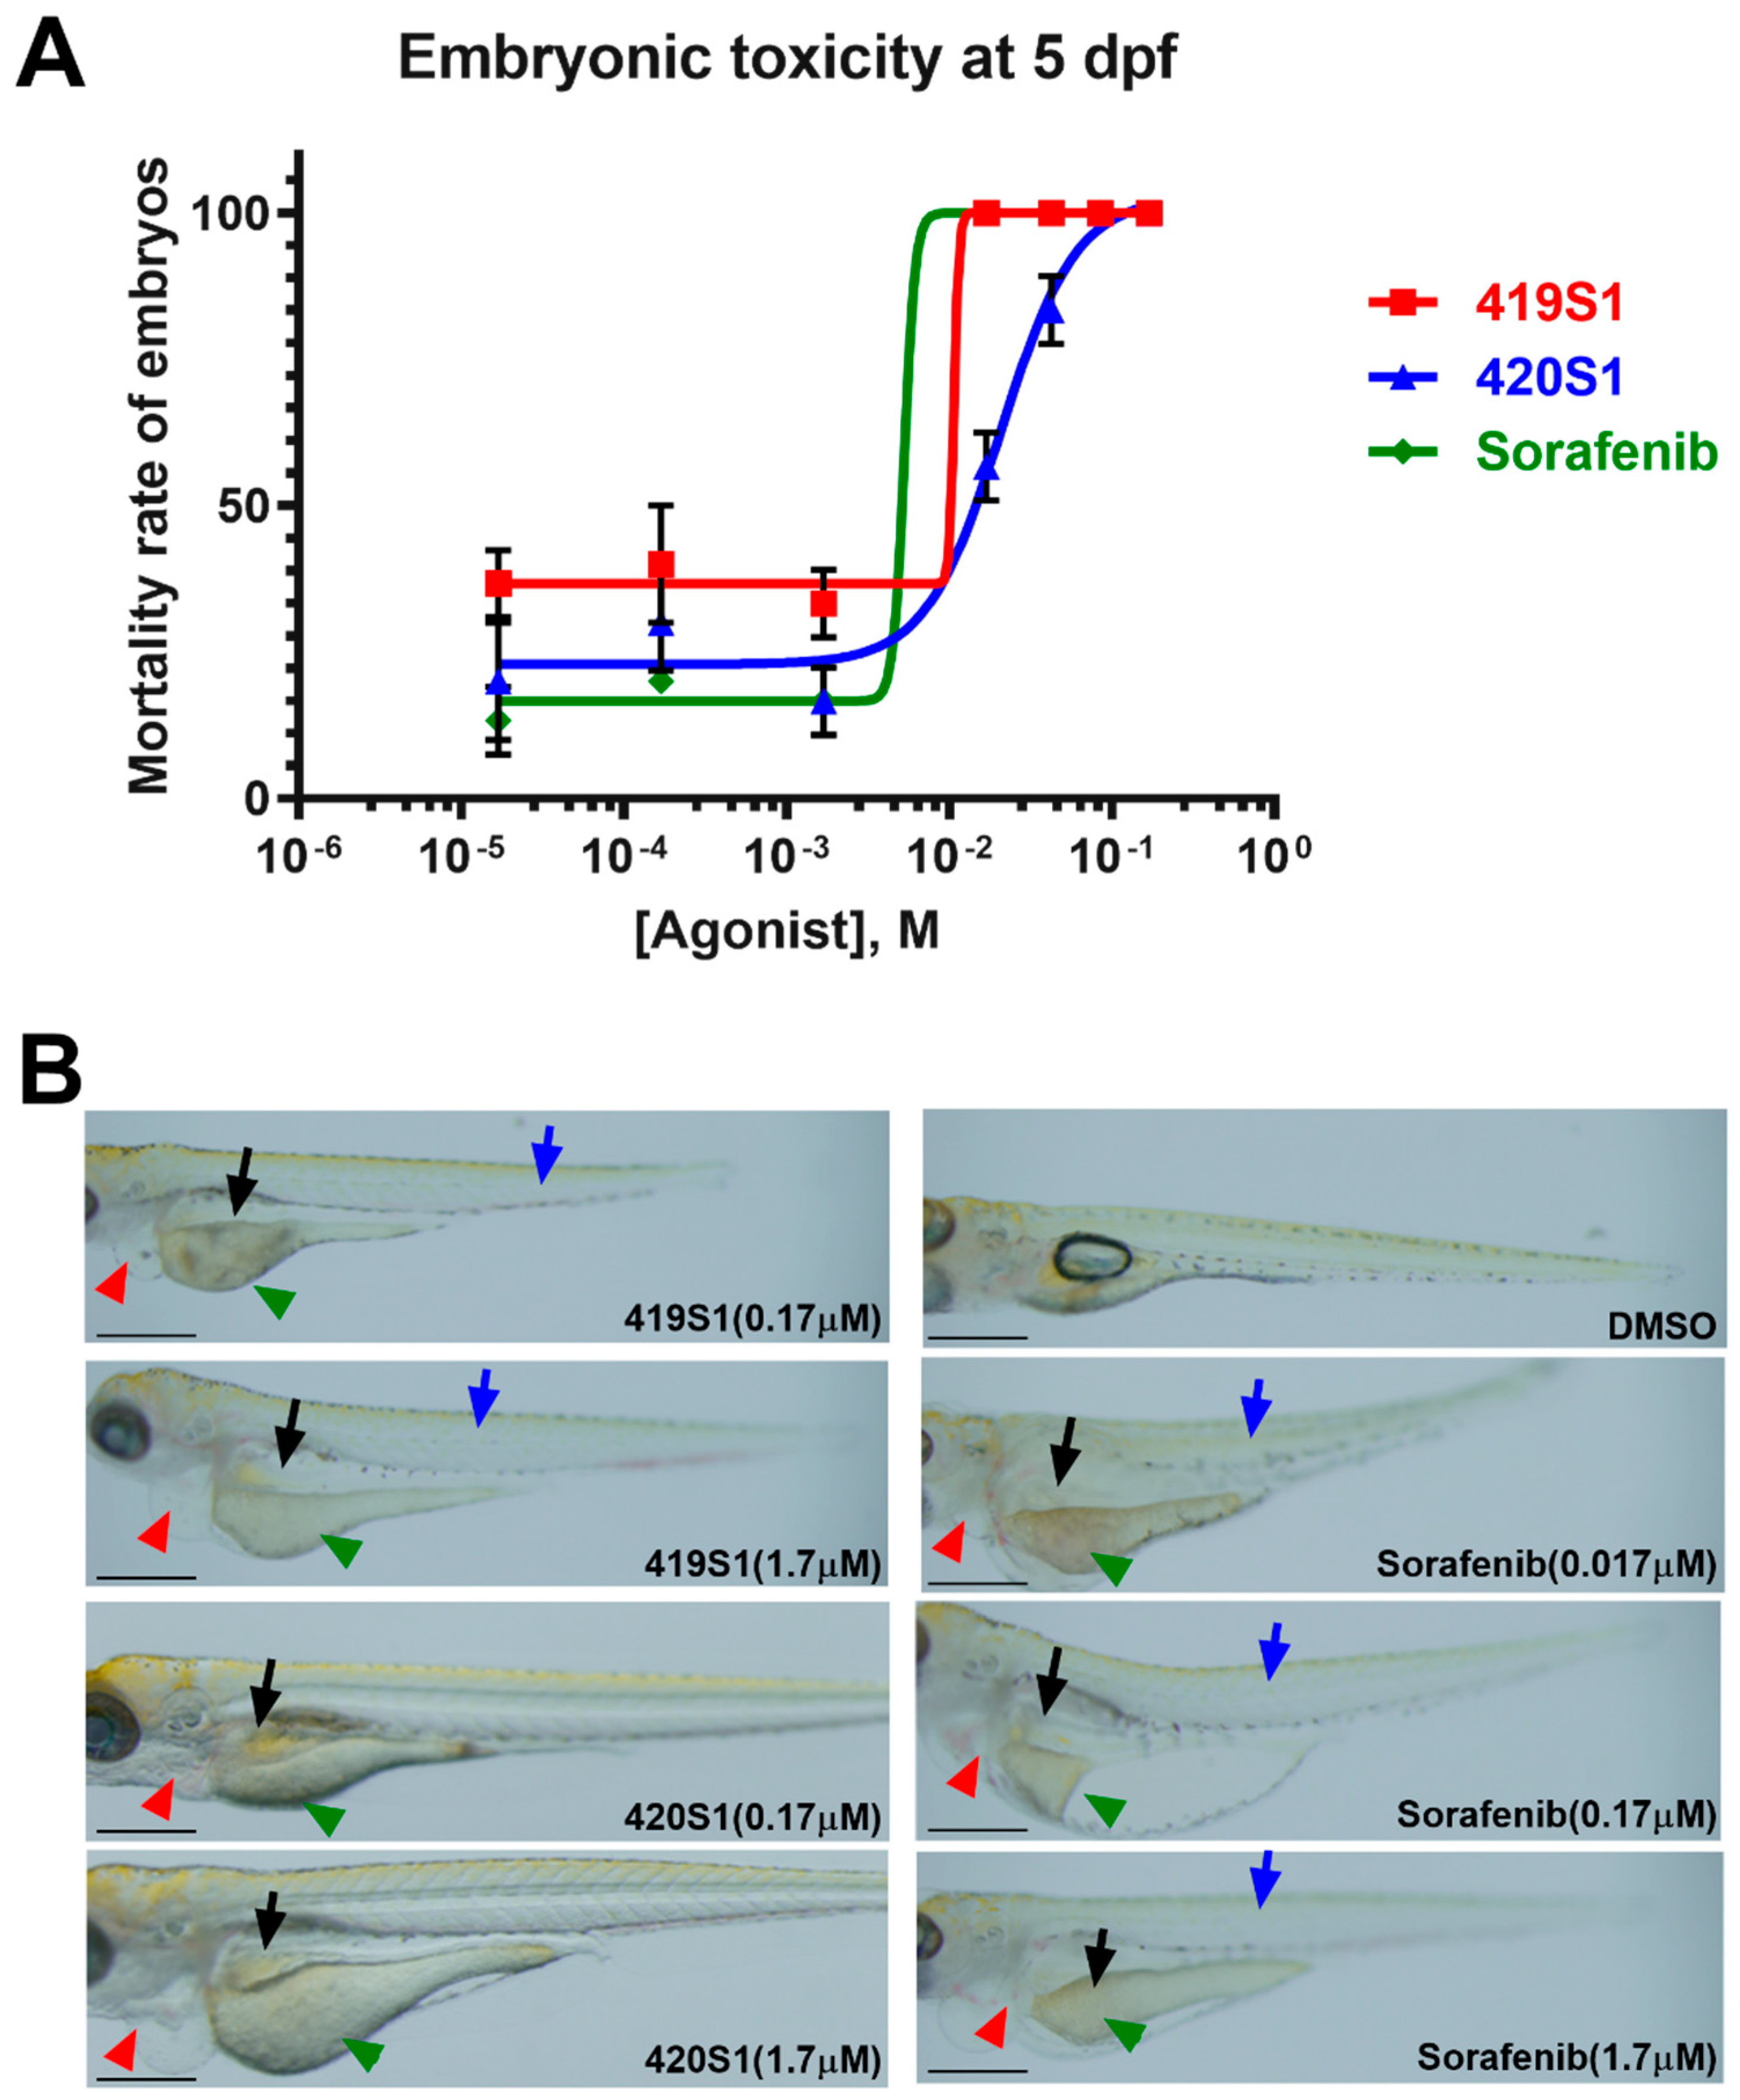
Fig. 4
The dose–response fitting mortality curve of wide-type embryos treated with 419S1, 420S1, and Sorafenib for five days, starting six hours post-fertilization. (A) Embryos treated with Sorafenib had a significantly higher mortality rate compared to 419S1 and 420S1. (B) Representative images of wild-type embryos treated with 419S1, 420S1, and Sorafenib at specified concentrations for five days. Abnormal embryonic phenotypes are shown with arrows. Red arrow: pericardial edema; green arrow: retarded yolk sac reabsorption; black arrow: retarded swim bladder inflation; blue arrow: spinal curvature and/or short body length. Scale bar: 0.2mm.