IMAGE

Fig. 8.

ID
ZDB-IMAGE-190723-2007
Source
Figures for Reuter et al., 2019
Image
Figure Caption

Fig. 8.

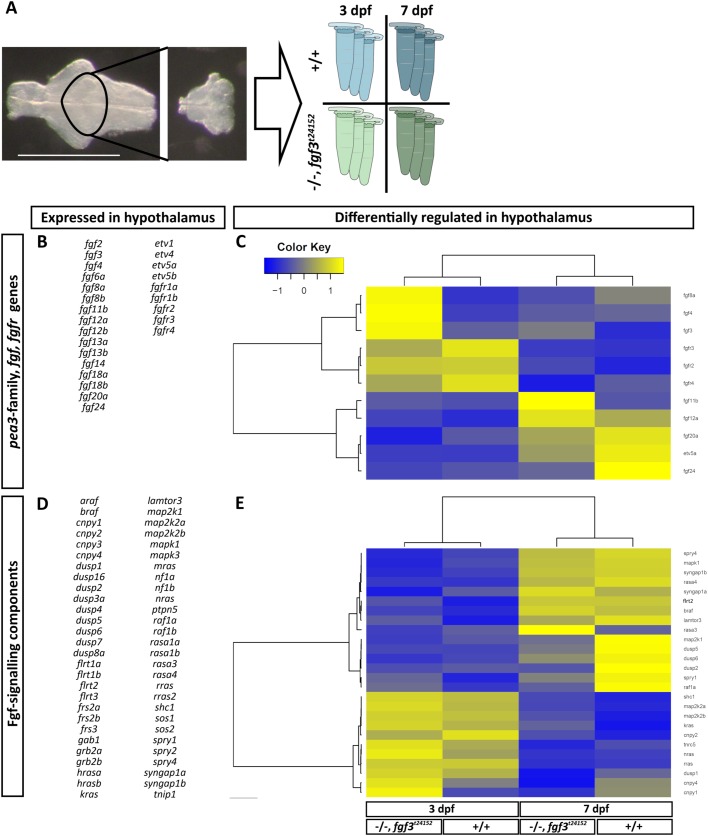
Hierarchical clustering of hypothalamic Fgf-signalling pathway genes and downstream targets analysed in fgf3t24152 mutants (−/−) and wildtypes (+/+) at 3 and 7 dpf. (A) Scheme illustrating sample preparation and groups used for RNA sequencing. Micrographs show the dissected hypothalamic area (ventral view, anterior to the left) collected from wild types (blue tubes) and fgf3t24152 mutants (green tubes) at 3 (light tubes) and 7 dpf (dark tubes). For each group, three independent tissue collections were performed resulting in a total of 12 samples processed for RNA sequencing. Scale bar: 500 µm. (B,D) List of fgfs, fgfrs, Fgf downstream target genes and Fgf-signalling components expressed (base mean ≥10) in the hypothalamus of −/− and +/+ embryos. All genes except shc2 pass the base mean threshold in all four groups. shc2 does not pass the base mean threshold in the 3 dpf −/− group. (C,E) Heat maps of differentially regulated (base mean ≥10, fold change ≥1.5) fgfs, fgfrs and Fgf downstream target genes (C) as well as Fgf-signalling components (E) in the hypothalamus of −/− and +/+ embryos. Columns represent z-score of mean values of replicates for each analysed group and rows depict individual genes. Colour key displays z-score ranging from ≥−1.5 to ≤1.5. Colour intensity represents expression levels of a gene for each group with blue or yellow indicating low or high expression.

Acknowledgments
This image is the copyrighted work of the attributed author or publisher, and ZFIN has permission only to display this image to its users. Additional permissions should be obtained from the applicable author or publisher of the image. Full text @ Biol. Open