IMAGE

Fig. 3.

ID
ZDB-IMAGE-190723-2002
Antibodies
Source
Figures for Reuter et al., 2019
Image
Figure Caption

Fig. 3.

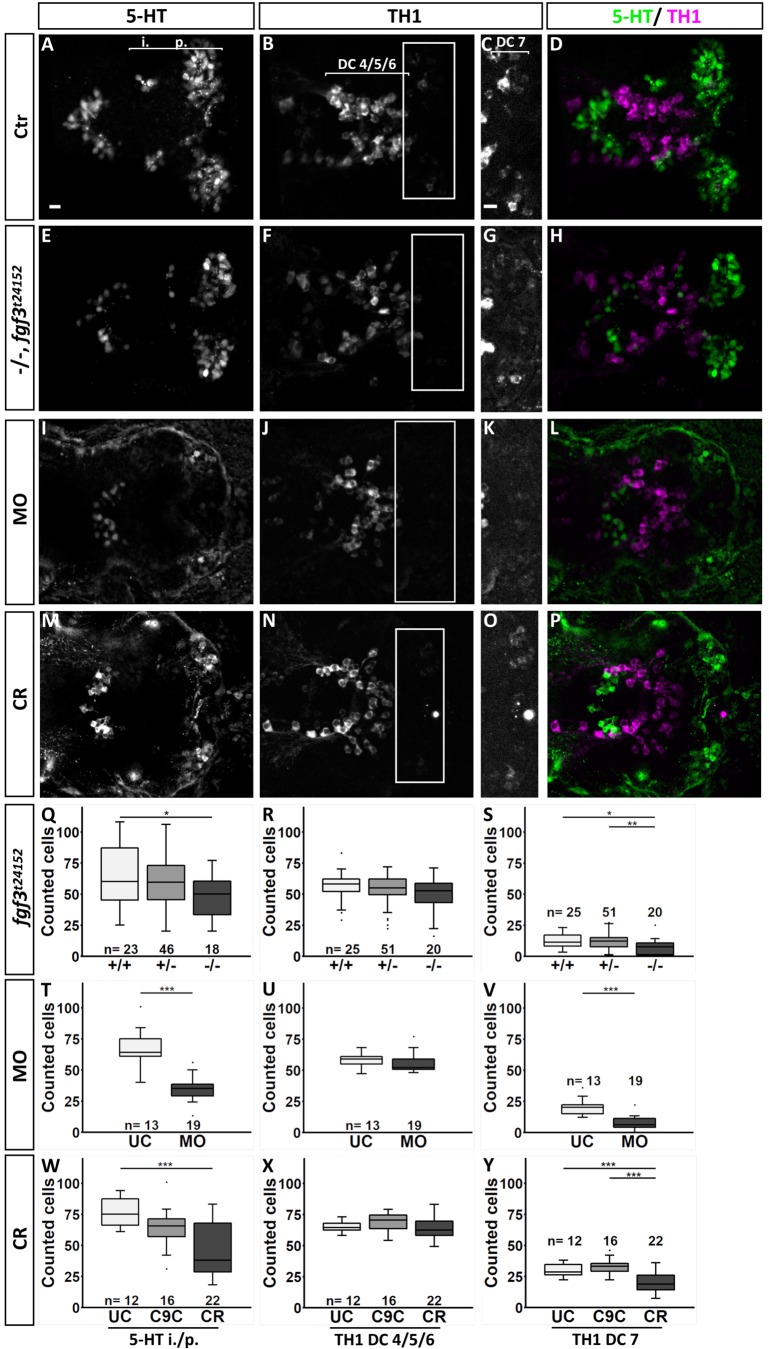
Quantification of the number of serotonergic cells in the intermediate (i.)/posterior (p.) clusters and of dopaminergic cells in the DC 4/5/6 and DC 7 clusters in the hypothalamus at 72 hpf after fgf3 impairment. (A–P) Confocal maximum intensity projections from wild-type controls (Ctr), homozygous fgf3t24152 mutants (−/−), fgf3 morphants (MO) or fgf3 CRISPR/Cas9-injected embryos (CR) immunostained for 5-HT (green) and TH1 (magenta) shown as single channels and merged. C,G,K and O show boxed areas in B,F,J and N, respectively, with adjusted brightness and contrast to reveal faint TH1 immunoreactive cells of the DC 7 cluster. Ventral views, anterior to the left. Scale bars: 10 µm. (Q–Y) Quantifications of 5-HT and TH1 positive cells after fgf3 impairment and in control siblings. The number of serotonergic cells was counted in the i./p. clusters as indicated by the line in A. The number of dopaminergic cells was counted in the DC 4/5/6 and DC 7 clusters as indicated by the lines in B and C. Tukey boxplots show median, 25–75% percentile, IQR whiskers and outliers. n=number of analysed individuals. +/−, heterozygous fgf3t24152 mutants; UC, uninjected siblings; C9C, injected with Cas9 only. *P>0.05, **P>0.01, ***P>0.001.

Figure Data
Acknowledgments
This image is the copyrighted work of the attributed author or publisher, and ZFIN has permission only to display this image to its users. Additional permissions should be obtained from the applicable author or publisher of the image. Full text @ Biol. Open