
|
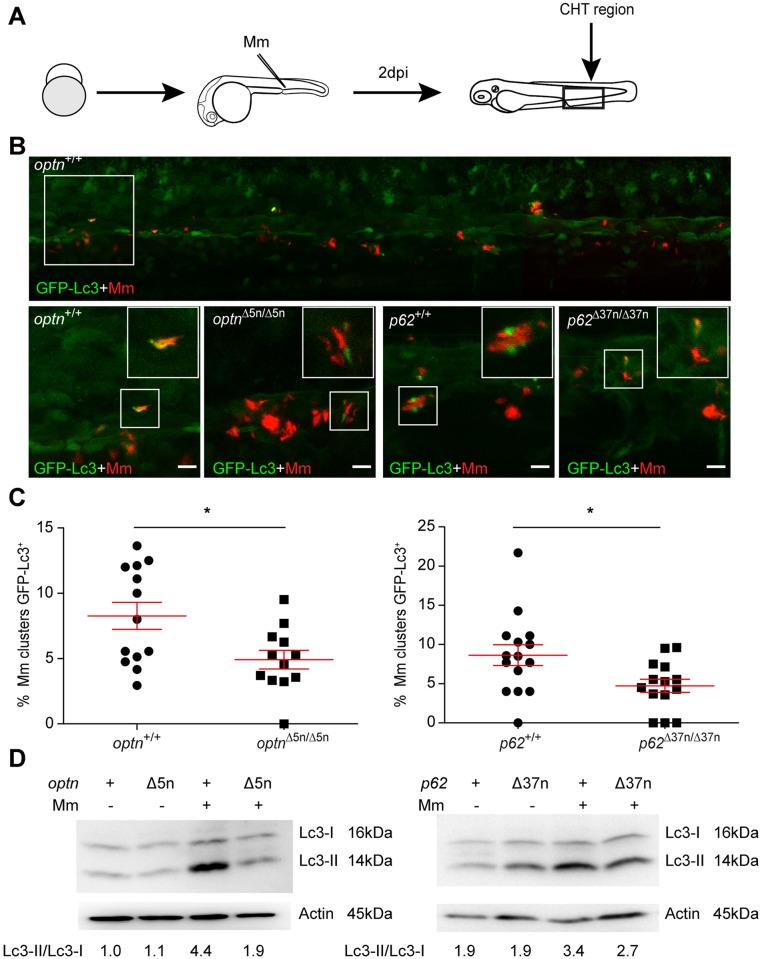
Fig 5
(A) Workflow of the experiment shown in B. 2 dpi fixed larvae were used for confocal imaging. The entire CHT region was imaged, as indicated by the black box. (B) Representative confocal micrographs of GFP-Lc3 co-localization with Mm clusters in infected larvae. The top image shows an overview of the CHT region in optn+/+ infected larvae. The area indicated by the white box is detailed below. The bottom images show GFP-Lc3 co-localization of Mm clusters in optn+/+, optnΔ5n/Δ5n, p62+/+ and p62Δ37n/Δ37n infected larvae. The arrowheads indicate the overlap between GFP-Lc3 and Mm clusters. Scale bars, 10 μm. (C) Quantification of the percentage of Mm clusters positive for GFP-Lc3 vesicles. The data is accumulated from two independent experiments; each dot represents an individual larva (≥12 larvae/group). ns, non-significant, *p<0.05, **p<0.01, ***p<0.001. (D) Western blot analysis of Lc3 protein levels in infected and uninfected larvae. Protein samples were extracted from 4 dpf larvae (>10 larvae/sample). The blots were probed with antibodies against Lc3 and Actin as a loading control and Lc3-II/Lc3-I ratios are indicated below. Western blots were repeated twice with independent extracts.