Fig. 5
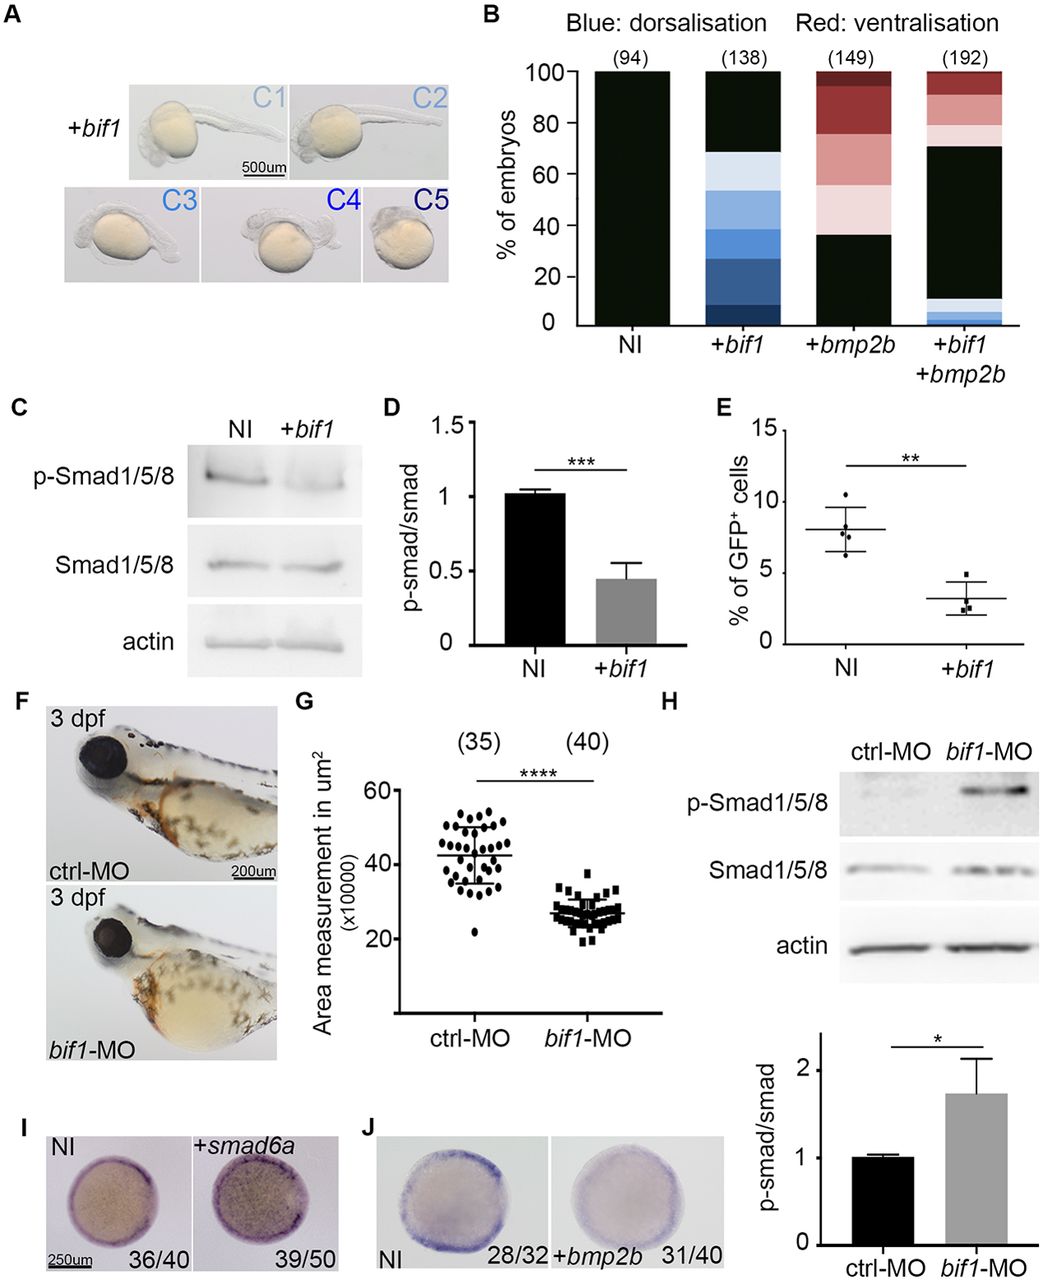
bif1 inhibits the BMP signaling pathway. (A) Bright-field images of 24 hpf embryos injected with bif1 mRNA. The embryos are classified depending of the dorsalization severity. (B) Quantification of embryos exhibiting the corresponding morphologies of dorsalization and ventralization. (C) Western blot of extracted proteins of non-injected embryos or embryos injected with bif1 mRNA at 6 hpf. (D) Quantitative analysis of western blot data. The values were obtained by dividing the p-Smad protein intensity value by its corresponding Smad intensity value. Data are mean±s.e.m. ***P<0.001. (E) Percentage of eGFP cells obtained by FACS analysis on Tg(BRE:eGFP) fishes. Each dot represents a pool of 20 embryos. Data are mean±s.e.m. **P<0.01. (F) Bright-field images from O-dianisidine-stained embryos at 3 dpf. The embryos were injected with control-MO or a bif1-MO. (G) Measurement of the left eye size in the embryos in F (the right eyes produce similar results). Each dot represents one single embryo. Data are mean±s.e.m. ****P<0.0001. (H) Western blot of extracted proteins at 23 hpf. The embryos were injected with a control morpholino or a morpholino against bif1. The graph below indicates the relative intensity of p-Smad protein levels compared with total Smad proteins. Data are mean±s.e.m. *P<0.05. (I) Whole-mount in situ hybridization for bif1 at 6 hpf in embryos injected with smad6 mRNA and non-injected controls. (J) Whole-mount in situ hybridization for bif1 at 6 hpf in embryos injected with bmp2b mRNA and non-injected controls. Statistical analysis was carried out using an unpaired Student's t-test.

