Image
Figure Caption
Fig. 3
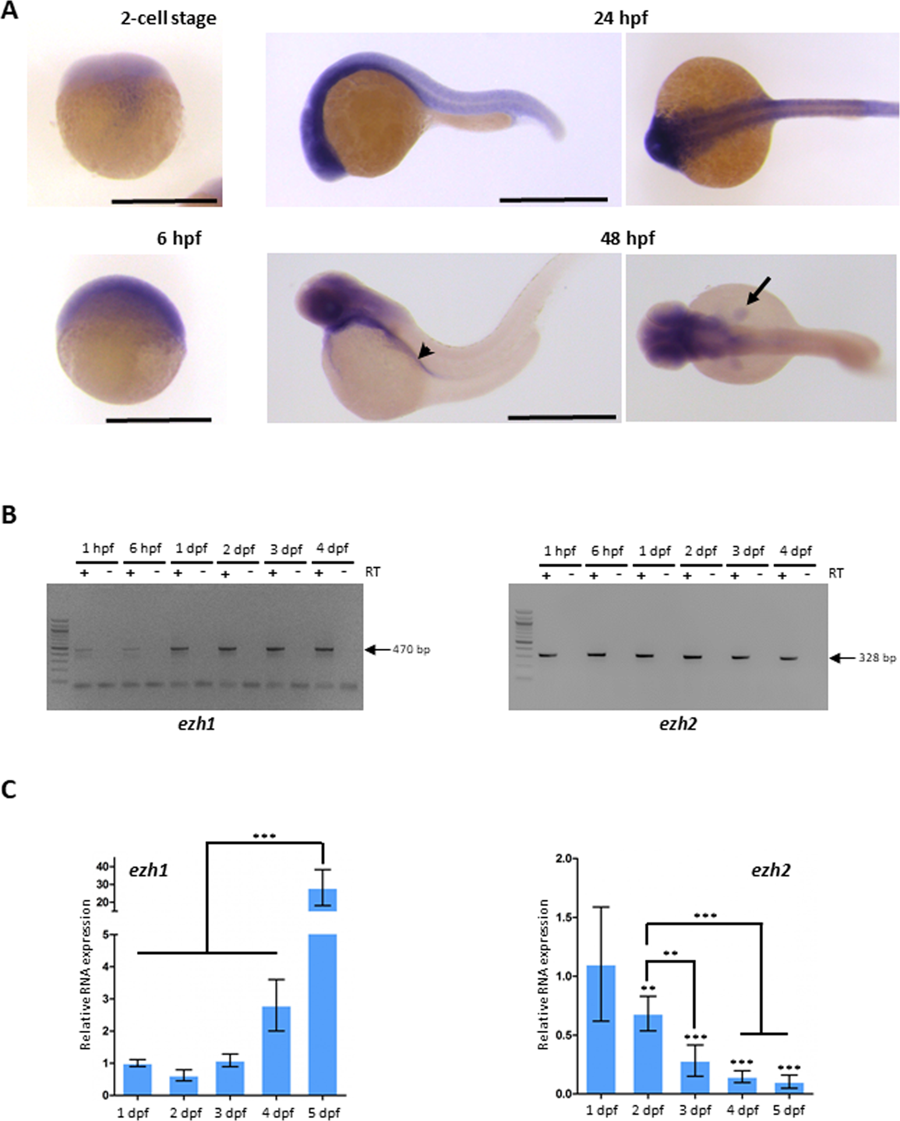
Ezh1 expression during zebrafish development. (A) In situ hybridization at the 2-cell stage, 6 hpf, 24 hpf and 48 hpf showing that ezh1 transcripts are maternally provided (2-cell stage) and showing zygotic ezh1 mRNA distribution during early development. The arrowhead shows the gut and the arrow the pectoral fin bud. Scale bar is 500 μm. (B) RT-PCR analysis showing detection of ezh1 and ezh2 mRNAs at 1 hpf, 6 hpf, 1 dpf, 2 dpf, 3 dpf and 4 dpf. The reverse transcriptase (RT) was included (+) or not (−) in the reaction, as indicated. (C) RT-qPCR showing that relative ezh1 expression increases during larval development from 1 dpf to 5 dpf whereas ezh2 expression decreases. Three independent experiments were performed and error bars represent standard deviation. Statistical analysis was performed using a one-way ANOVA with Tukey’s post hoc test. **P < 0.01; ***P < 0.001.
Figure Data
Acknowledgments
This image is the copyrighted work of the attributed author or publisher, and
ZFIN has permission only to display this image to its users.
Additional permissions should be obtained from the applicable author or publisher of the image.
Full text @ Sci. Rep.

