Fig. 1
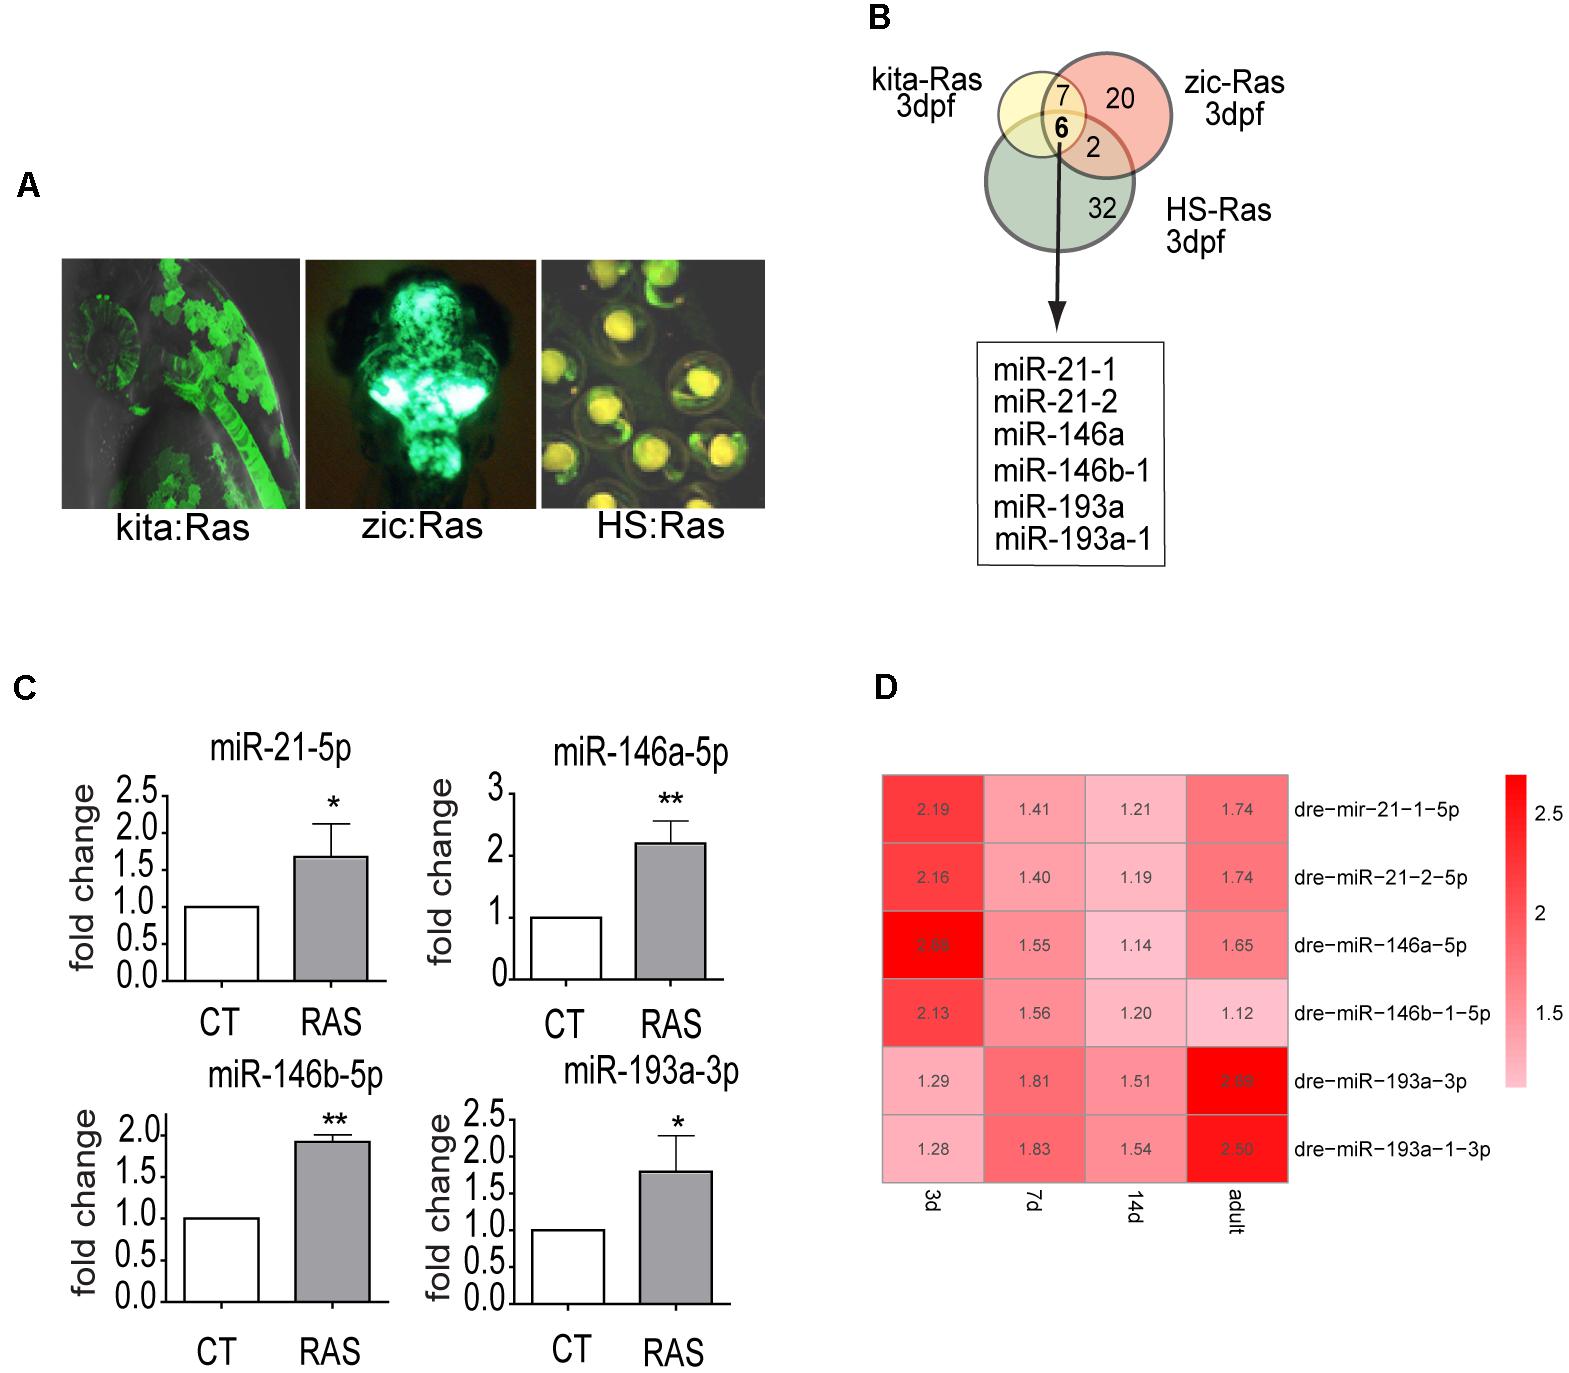
miR-21, miR-146a/b, and miR-193a are upregulated by oncogenic RAS in transgenic cancer models. (A)Zebrafish models used in the study of Ras-dependent microRNAs. Green fluorescence denotes the expression of the eGFP-fused oncogene. In Kita:Ras GFP labels transformed melanocytes and notochord; in zic:Ras GFP marks ras-expressing brain cells; in HS-Ras, eGFP-Ras is expressed in whole embryos. For full description of transgenic lines, see text. (B) Diagram depicting the overlap between the three sets of upregulated microRNAs. (C) Taqman QPCR analysis of miR-21, miR-146a/b, and miR-193a expression levels in 3 dpf kita-RAS larvae compared to control (CT) larvae. The error bar represents the SEM of a triplicate experiment. (D) Heatmap representation of microarray analysis of miR-21, miR-146a/b, and miR-193a expression at different stages of melanoma progression. Distinct precursor sequences and genomic loci that express identical mature sequences are named on the form miR-21-1 and miR-21-2. Lettered suffixes denote closely related mature sequences. –5p and –3p indicate the 5′ and 3′ arm respectively. ∗P ≤ 0.05 and ∗∗P ≤ 0.01.

