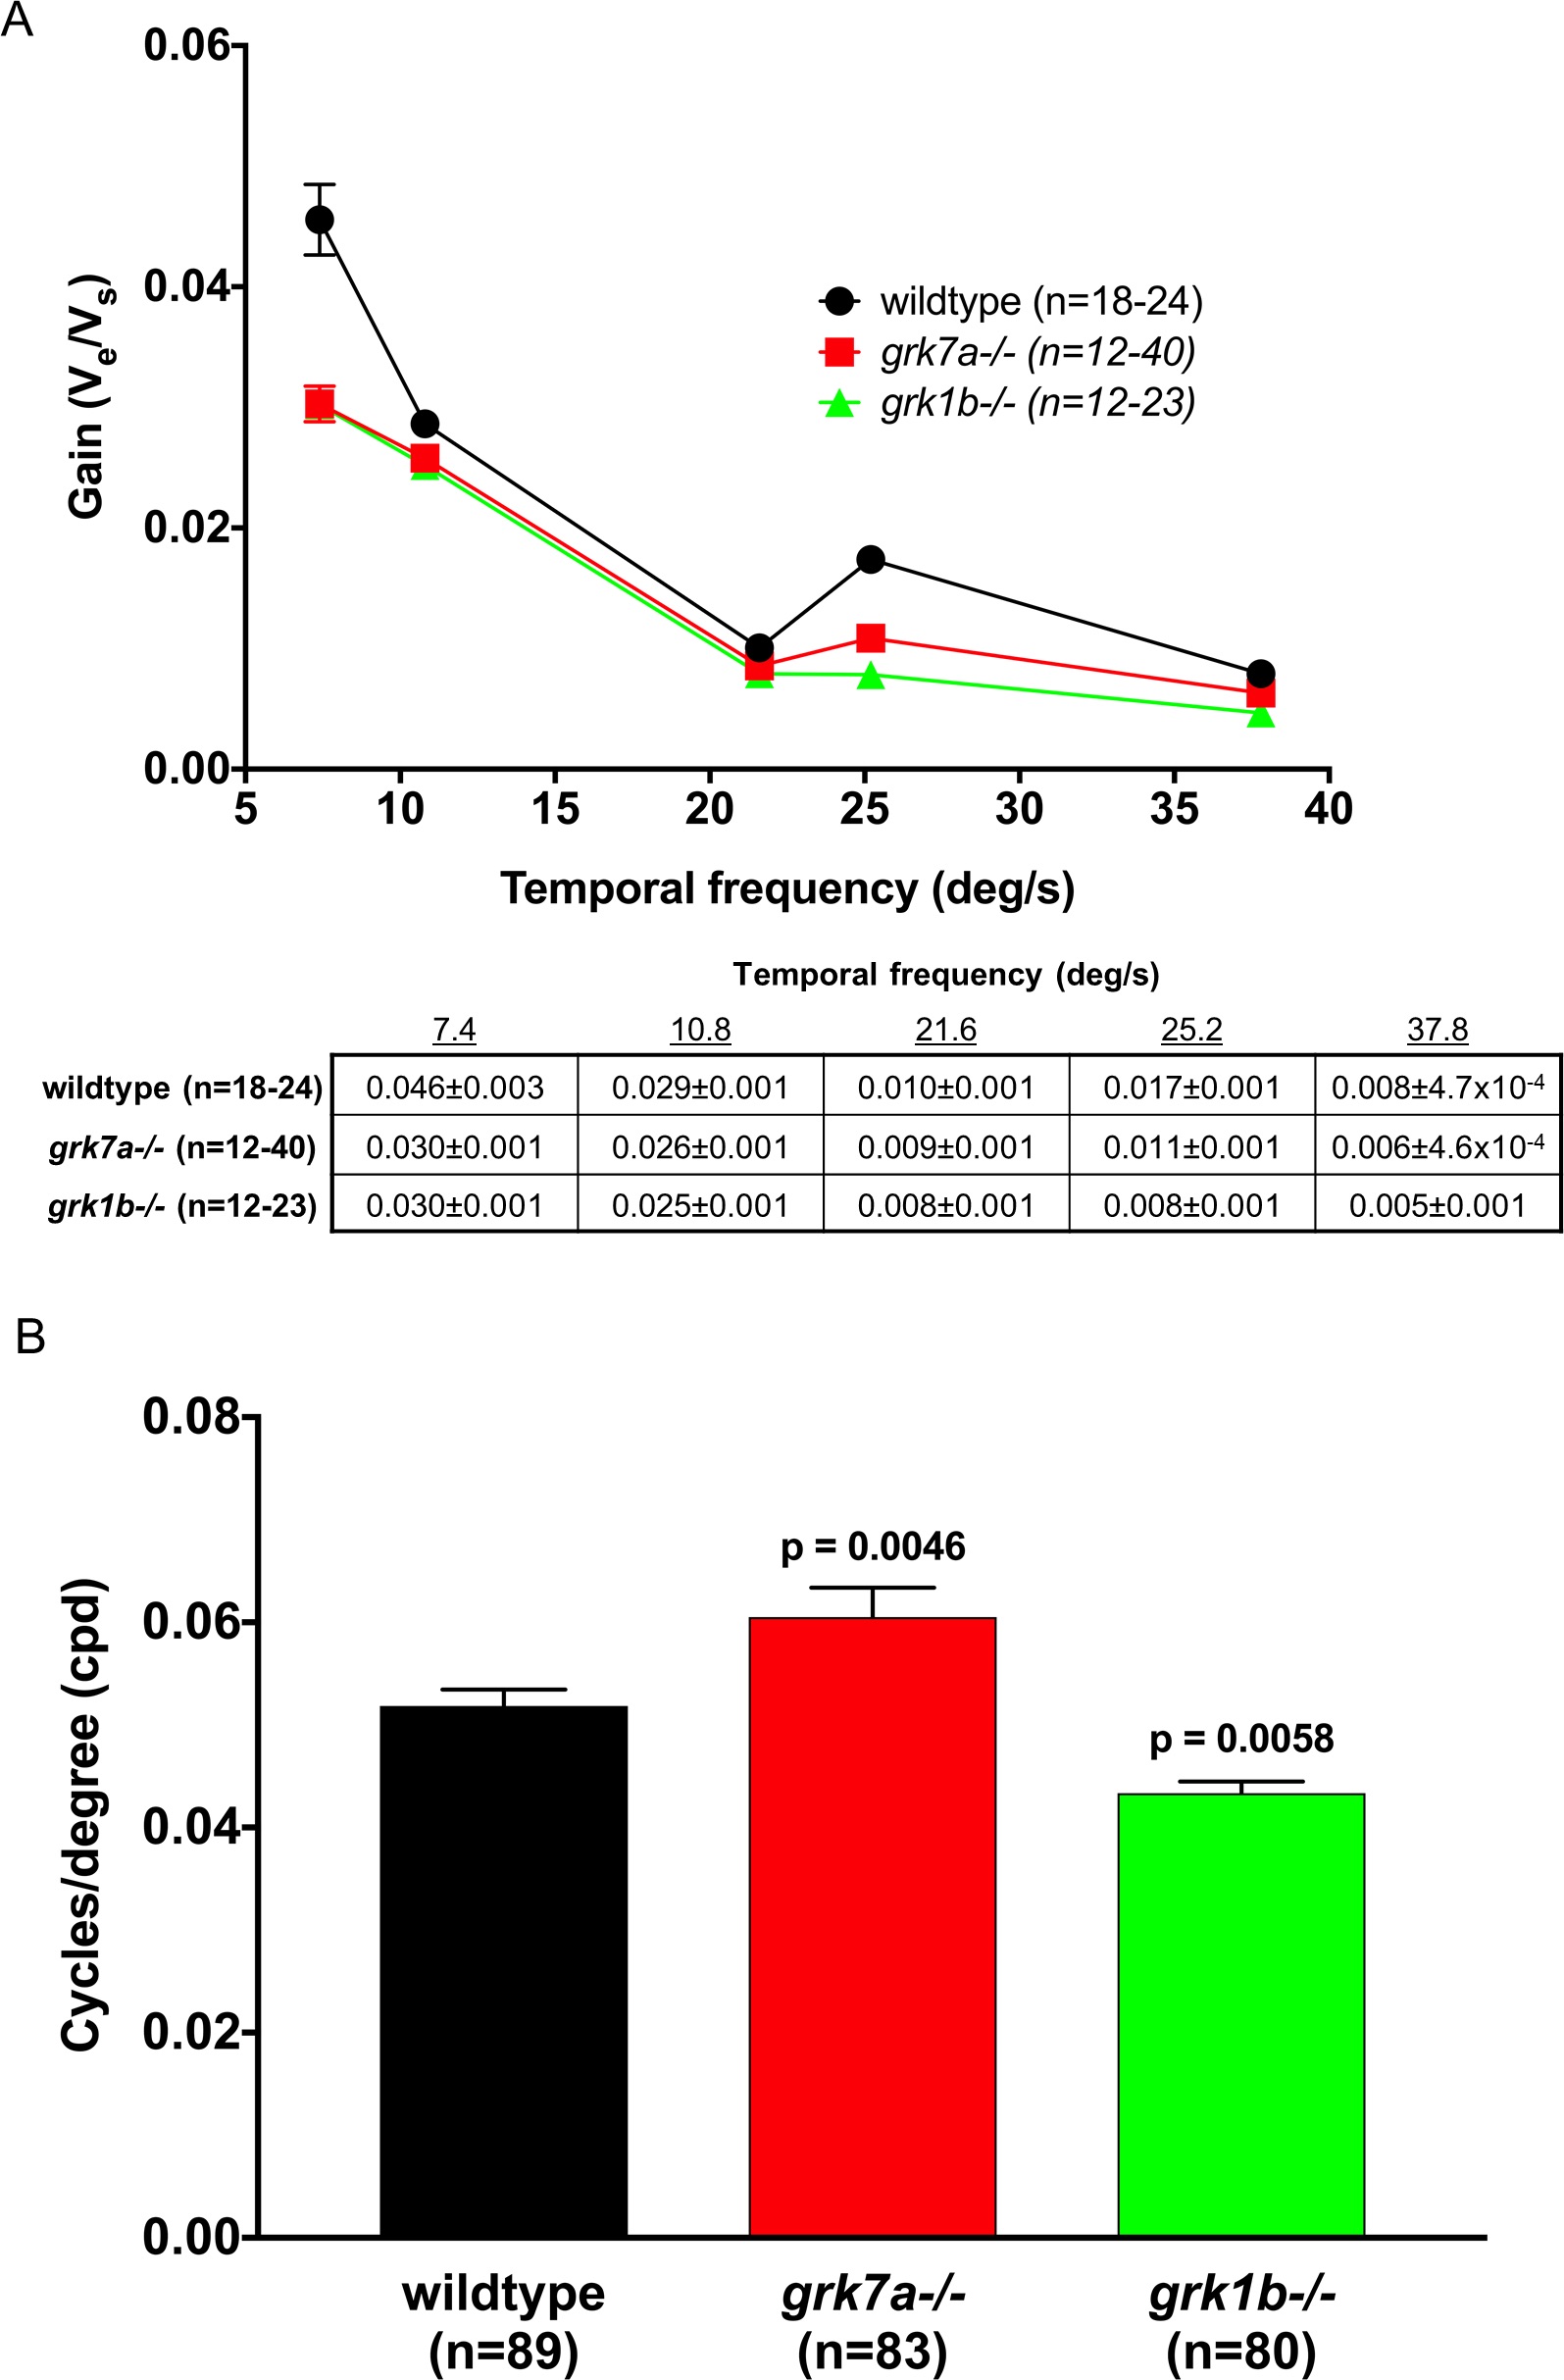
Fig. 6 Temporal contrast sensitivity and visual acuity of grk1b and grk7a knockout larvae. Optokinetic response measurements of larval knockout zebrafish at 6 dpf. (A) Optokinetic gain as function of temporal frequency of a sinewave grating. A linear mixed model analysis of covariance found a significant effect of genotype when compared to wildtype for grk1−/− (F[1,209] = 32.9; P < 0.001) and grk7a−/− (F[1,193] = 21.4; P < 0.001) larvae. The accompanying table shows all means and standard errors from the graph. (B) Visual acuity measured in cycles/degree (cpd). P-values were obtained using the Bonferonni post hoc test following 1-way ANOVA. Error bars represent SEM.
Image
Figure Caption
Figure Data
Acknowledgments
This image is the copyrighted work of the attributed author or publisher, and
ZFIN has permission only to display this image to its users.
Additional permissions should be obtained from the applicable author or publisher of the image.
Full text @ Invest. Ophthalmol. Vis. Sci.

