Fig. 7
Fig. 7
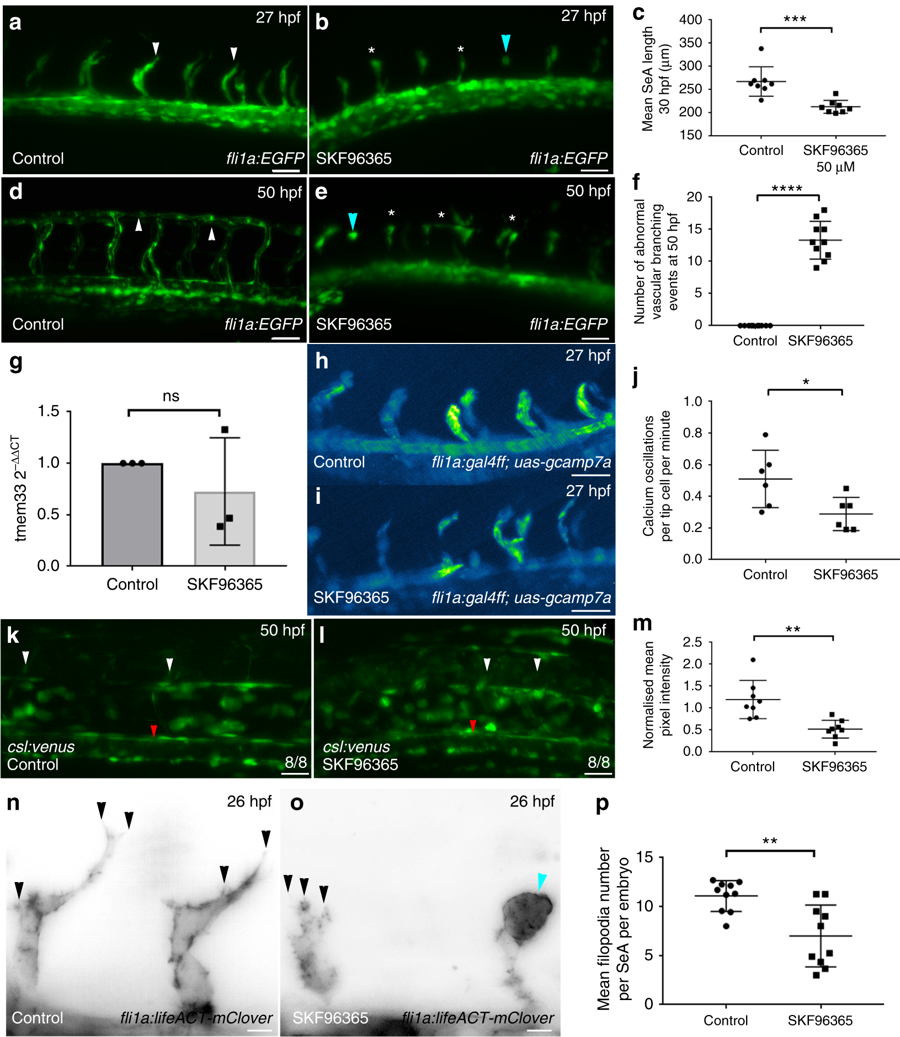
SOCE inhibition limits sprouting angiogenesis and disrupts signalling pathways downstream of VEGF. a, b SKF9635 impairs angiogenesis in Tg(fli1a:EGFP) embryos (white arrowheads) and induces abnormal tip cell morphology (blue arrowhead) by 27 hpf. Scale bars 50 µm. c SKF-96365-treated embryos display reduced SeA length by 27 hpf (unpaired t-test; p = < 0.0001; t = 11.22 DF = 14; 2 repeats, n = 4 embryos per group). d, e SKF-96365 treatment impairs DLAV formation (white asterisks) in comparison with control embryos, which form the DLAV normally by 50 hpf (white arrowheads). Abnormal tip cell morphology (blue arrowhead) remain in SKF-96365-treated embryos by 50 hpf. Scale bars 50 µm. f SKF-96365-treated embryos display increased frequency of abnormal vascular branching (stunted SeAs or incomplete DLAV anastomosis) by 50 hpf (unpaired t-test; p = < 0.0001; t = 14.28 DF = 18. n = 2 repeats, n = 5 embryos per group). g tmem33 expression is not significantly altered by SKF-96365 treatment (unpaired t-test; t = 0.911, DF = 4, n = 3 repeats). h–j SKF-96365 reduces frequency of endothelial Ca2+ oscillations in Tg(fli1a:gal4FFubs3;uas-gcamp7a) embryos. Intensity projection over time showing calcium oscillations in control embryos, highlighting intensity change over duration of time lapse (unpaired t-test; p = < 0.05; t = 2.594, DF = 10, n = 2 repeats, 3 embryos per group). k, l Notch reporter expression is reduced in SeAs (white arrowheads) and DA (red arrowhead) of Tg(csl:venus) embryos. Scale bars 50 µm. m DA expression of Notch reporter is reduced by SKF treatment (unpaired t-test, **p = 0.0097, t = 3.982 DF = 15, 2 repeats, n = 4 embryos per group). n, o SKF-96365 treatment reduces endothelial filopodia number (black arrowheads) and abnormal spade-shaped tip cell morphology (blue arrowhead), in Tg(fli1a:lifeact-mClover) embryos. Scale bars 5 µm. p SKF-96365 treatment reduces mean filopodia number per SeA per embryo by 26 hpf (unpaired t-test; p = < 0.05; t = 2.525, DF = 10, n = 2 repeats, n = 5 embryos per group). Source data are provided as a Source Data file

