Fig. S4
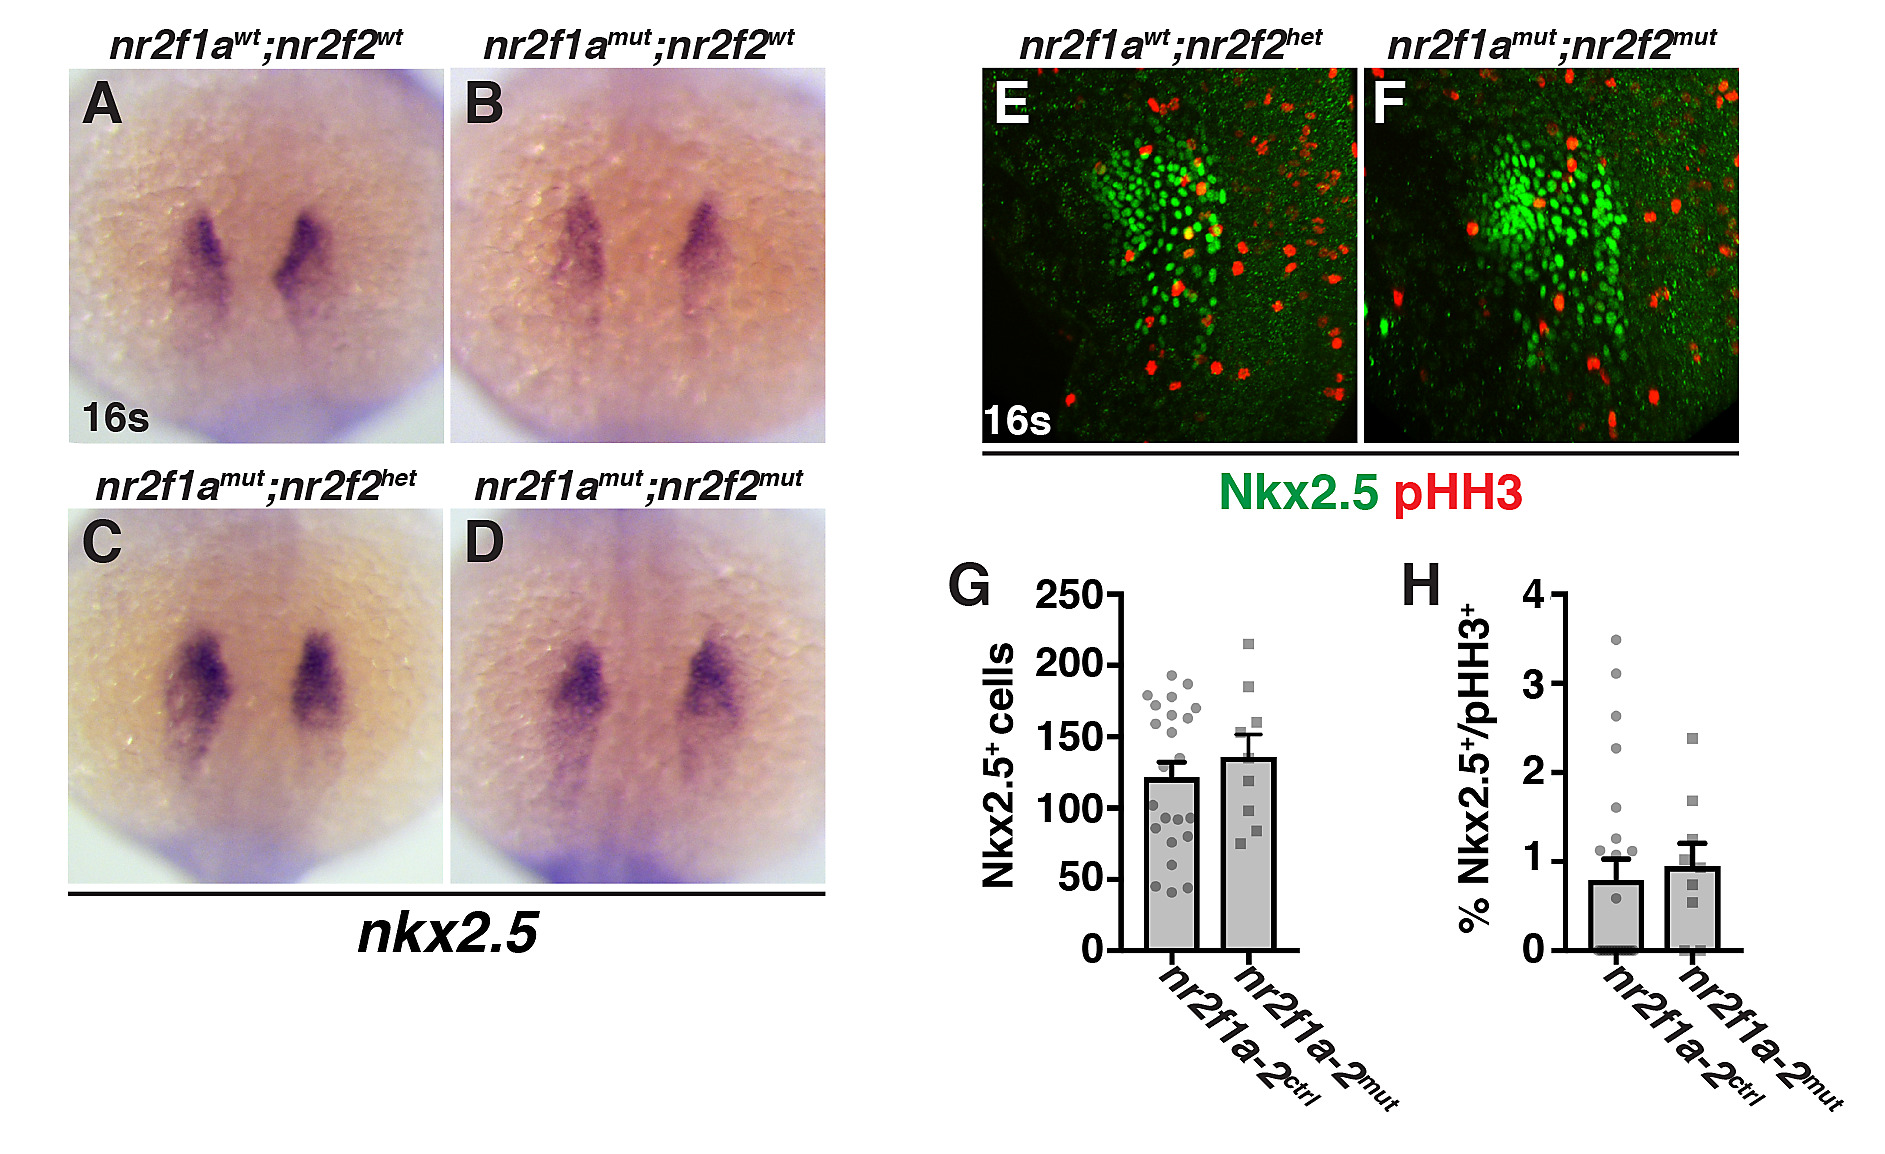
(A-D) ISH for the cardiac progenitor marker nkx2.5 in nr2f1awt; nr2f2wt, nr2f1amut; nr2f2wt, nr2f1amut; nr2f2het, and nr2f1amut; nr2f2mut embryos at the 16s stage. Dorsal view with anterior up. 160 embryos were examined with ≥9 embryos examined for each condition. Although we observed a trend in the expansion of nkx2.5 expression when assaying area of expression similar to vmhc, due to inherent variability in nkx2.5 expression and the low numbers of embryos, it was not statistically significant. (E,F) IHC for Nkx2.5 and pHH3 in nr2f1awt; nr2f2het and nr2f1amut; nr2f2mut embryos at the 16s stage. Confocal images of the ventro-lateral side of the embryo. Dorsal is right and anterior up. A single side of each embryo was used for analysis. (G) Number of Nkx2.5+ cells in control and nr2f1a; nr2f2mutant embryos. (H) Percentage of pHH3+/Nkx2.5+ in control and nr2f1a; nr2f2 mutant embryos. For quantification of Nkx2.5+ and pHH3+/Nkx2.5+ cells, nr2f1a homozygous mutants (nr2f1amut) coupled with nr2f2 heterozygosity (nr2f2het) or nr2f2 mutant homozygosity (nr2f2mut) were analyzed together (referred to as nr2f1a-2mut), because our data suggest loss of a single WT nr2f2 allele in nr2f1a mutants produces a similar increase in ventricular CMs as double mutants. Nr2f1a-2ctrl includes any combination of nr2f1a and nr2f2 WT and heterozygous alleles. nr2f1a-2ctrl (n = 23) and nr2f1a-2mut (n = 9) for G and H.

