Fig. 7
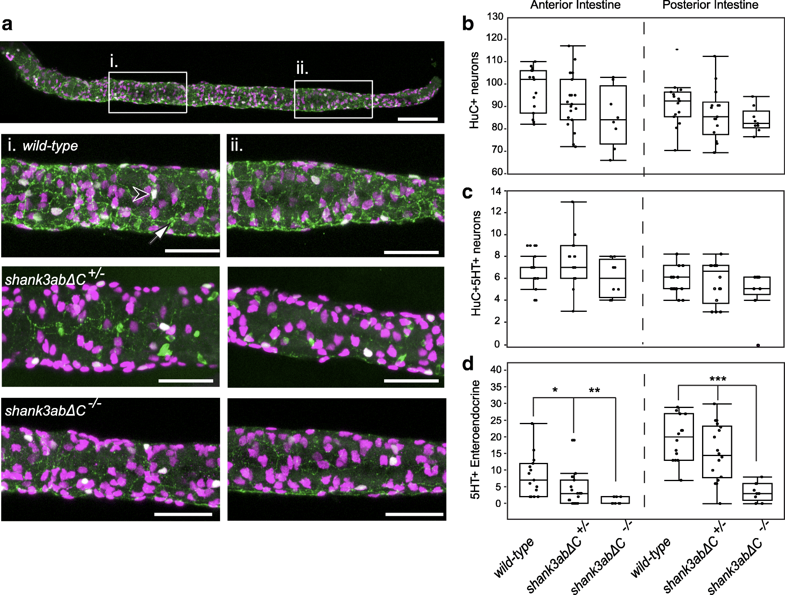
Shank3abΔC mutants have a reduction in enteroendocrine cells. a Anterior (i.) and posterior (ii.) regions were sampled to quantify the number of enteric neurons (HuC, magenta), serotonin enteric neurons (HuC+/5-HT+, white, black arrowhead), and enteroendocrine cells (5-HT+, green, white arrow). Shank3abΔC mutants did not show a significant decrease in either b enteric neurons or c serotonin positive enteric neurons. d Serotonin positive enteroendocrine cells were significantly decreased in shank3abΔC mutants for both anterior and posterior regions. WT, n = 15;shank3abΔC +/−, n = 19; shank3abΔC −/−, n = 9. Scale bars represent 100 μm (a) and 50 μm (i, ii)
Image
Figure Caption
Figure Data
Acknowledgments
This image is the copyrighted work of the attributed author or publisher, and
ZFIN has permission only to display this image to its users.
Additional permissions should be obtained from the applicable author or publisher of the image.
Full text @ Mol Autism

