Fig. 4
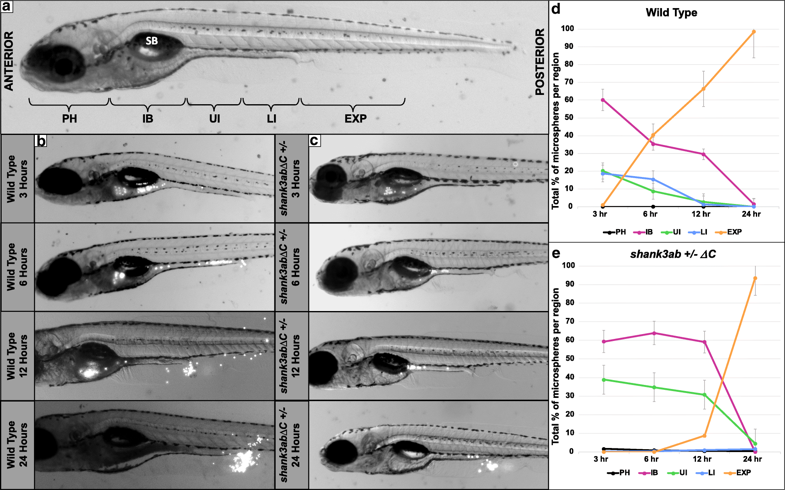
DT transit time of fluorescent beads is prolonged in shank3abΔC+/− mutants compared to WT larvae. a Regions of the DT analyzed for fluorescent bead occupancy are indicated on a 7-day-old zebrafish larva. Beads were tracked as they passed through five key regions: PH (pharynx), IB (intestinal bulb), UI (upper intestine), LI (lower intestine), and EX (expelled). The swim bladder (SB) is labeled for reference. b Images of a representative WT fish at 3, 6, 12, and 24 h post-feed. Beads appear white and can be seen throughout the DT and collecting near the anus post-expulsion. c Images of a representative shank3abΔC +/− larva at 3, 6, 12, and 24 h post-feed. d Graph of bead distribution per time point for WT fish. Each point represents the average +/− standard error of the percentage of total beads held by each region (PH, IB, UI, LI, or EXP) over time (n = 13). e Graph of shank3abΔC +/− mutant average +/− standard error bead distribution over time (n = 15)
Image
Figure Caption
Figure Data
Acknowledgments
This image is the copyrighted work of the attributed author or publisher, and
ZFIN has permission only to display this image to its users.
Additional permissions should be obtained from the applicable author or publisher of the image.
Full text @ Mol Autism

